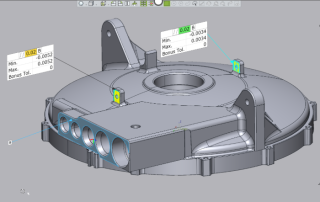
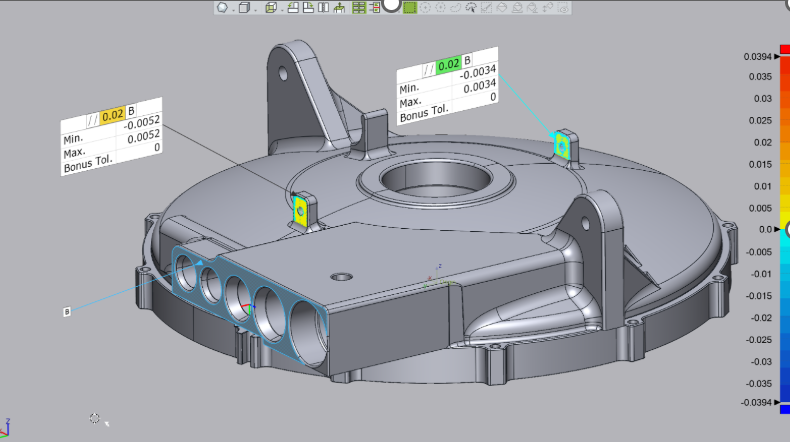
Color Mapping Fitting Deviation
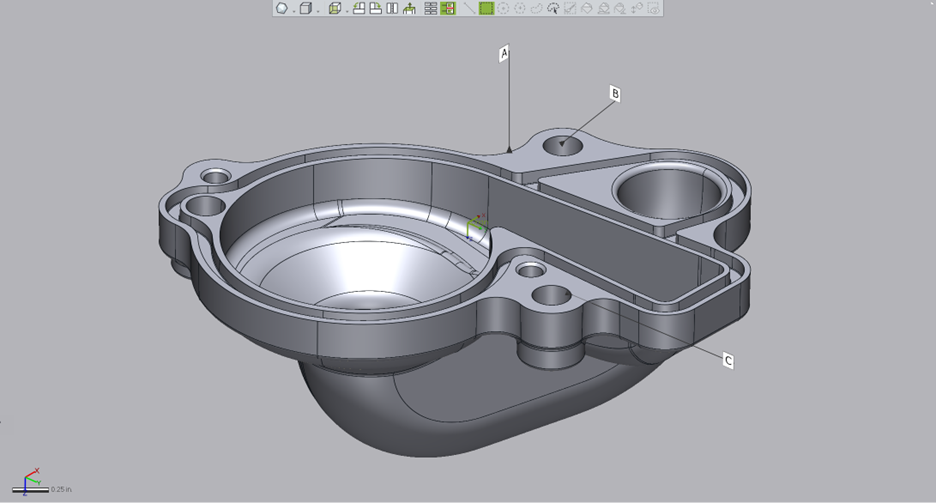
In each of the Control X GD&T commands, users have the ability to color map the Fitting Deviation. So when checking for Flatness, for example, along with being able to show the Min and Max deviations as we do in the examples below, users can actually color map those differences. Below we show that the flatness of this face is within its assigned Flatness tolerance of .002” as the Min and Max values are +/-.0008”. [...]


