Planned vs. Achieved Results from Dental Aligners
While most Control X users are inspecting mechanical parts by comparing the manufactured results to the nominal CAD model, there are many other uses for Control X, such as in the dental industry. We will explore some of the benefits of using Control X in the dental industry in this post.
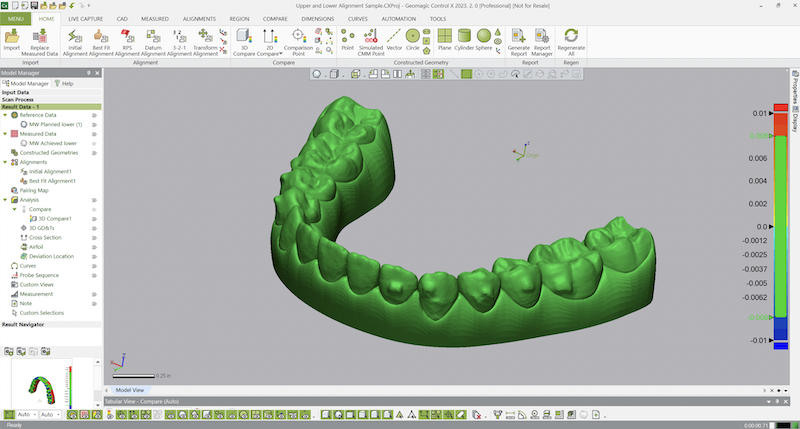
For example, companies that manufacture aligners have methods and algorithms in place for predicting what the final results will be for a patient, once their aligners are removed. They examine the patient, design an alignment strategy, and install the alignment device to hopefully shift teeth to their ideal locations. Below is an example of an alignment result prediction. This model was computer-generated, showing the anticipated results of utilizing an alignment strategy for 6 months. Please note that this is an upper teeth set but we are showing them upside down to make the results easier to see.
After the 6 month period elapses, we can then utilize Control X to determine how well the predicted results came out.
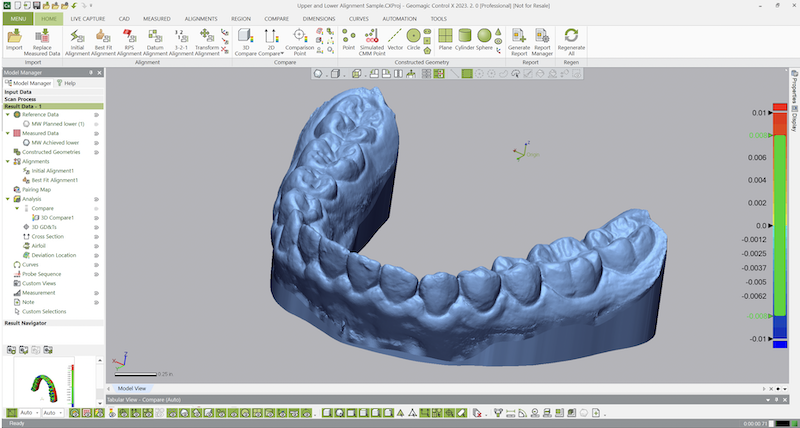
The Orthodontist takes actual scans of the patient’s teeth, using an intraoral scanner after the alignment treatment is complete. Below is a result of the actual alignment.
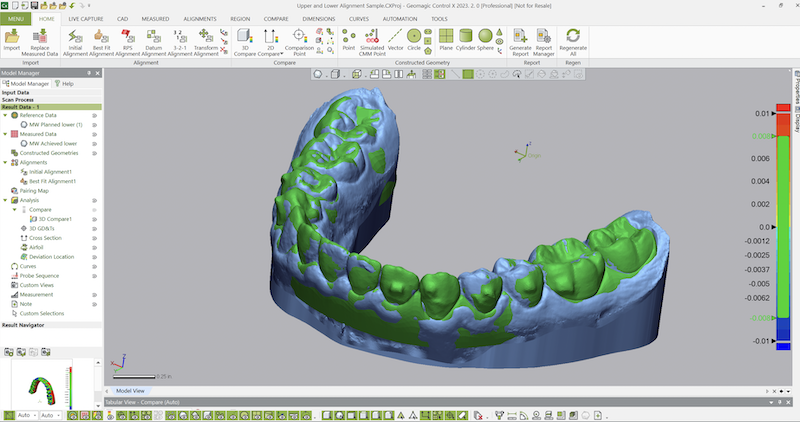
The next step is to align the predicted result model to the actual result and check for differences. Here is where the tools in Control X become invaluable for this type of measurement. First, we use Control X to align the actual to the planned adjustment. The result of that alignment is shown below.
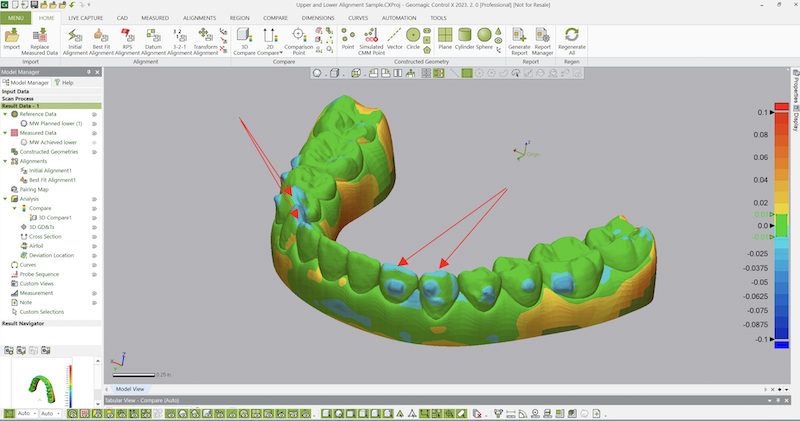
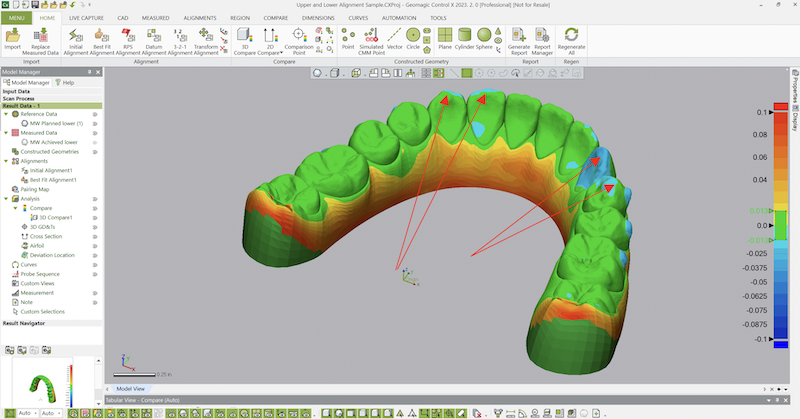
Next, we can ask Control X to create a color map, highlighting the differences between the predicted alignment to the actual. Below we can see that the first Bicuspid and the Cuspid (Canine) have slight discrepancies between predicted vs actual results as well as the first and second Bicuspid on the opposite side. All other locations where the color map shows green indicate that the aligner did its job properly! The red arrows point to locations where slight discrepancies exist between what was predicted as an outcome vs the actual outcome.
We can utilize additional Control X measuring tools to do more precise testing to see just how far the predictions were off by measuring distances, twist angles, etc.
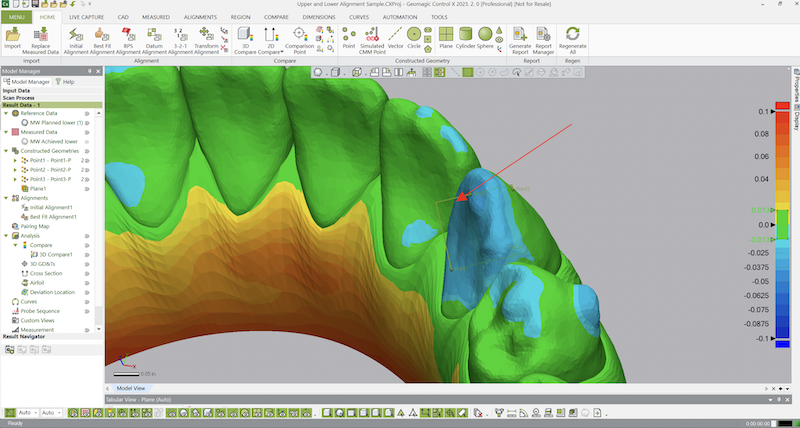
We create a plane to bisect the first Bicuspid.
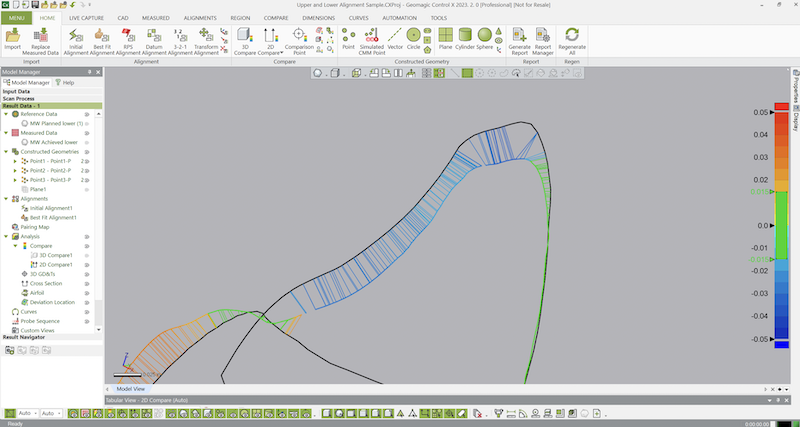
By taking a slice through the aligned scans, we can measure distances at areas of interest. Through planar color mapping (aka “Whisker Plots”), we can see the shift and twist at a slice through the tooth where the black represents the Planned result and the colors represent the Achieved. The “whiskers” show the normal distances between planned and achieved results.
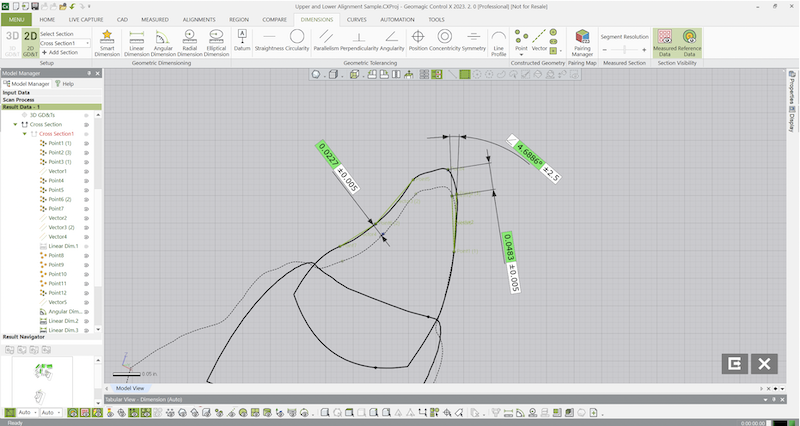
Dialing in deeper, we can take measurements from this planar data as well. We can create points on both the Reference and Measured section slices and take distance and angular measurements where the solid curves represent the Reference (Planned) results and the dashed curves represent the Measured (Achieved or actual) results.
This concludes this Metrology Minute. Please contact Joel Pollet with any questions.

Leave A Comment