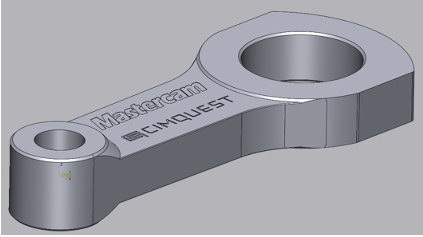
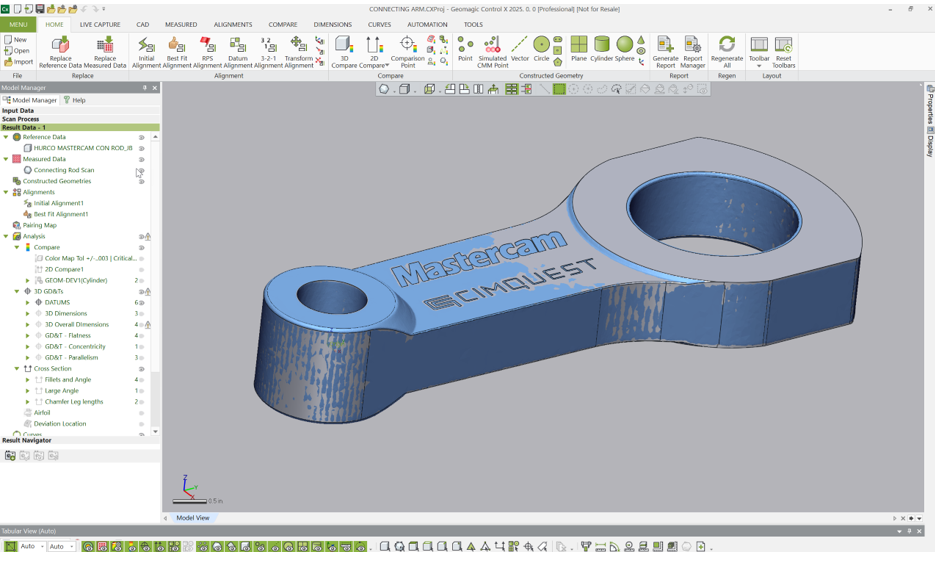
This month’s Metrology Minute will focus on a capability of Control X called Color Map Fitting, which is an extremely useful ON and OFF switch to use for analyzing the results of a GD&T callout. GD&T will typically check for a specific criteria to be within an acceptable tolerance and the user is looking for a Pass or Fail response. Consider a connecting arm that looks like the one below.
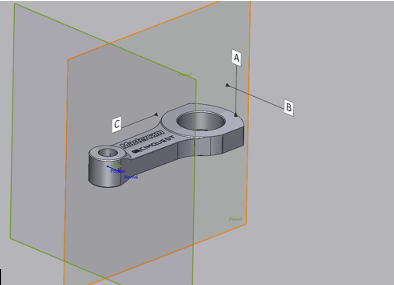
Where Datum A is the top large face of the part and Datum B (colored orange) is the centerline along the YZ Plane and Datum C (colored green) is the centerline along the XZ Plane.
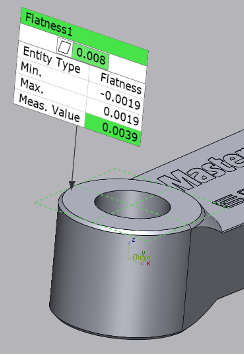
Now, let’s consider measuring the Flatness on top of the small end of the rod. When we place a Flatness GD&T callout on that face, Control X has the ability to check that the desired tolerance, within a specific tolerance, is met. Control X can also return the min and max tolerance values (see callout below). Please note that Flatness callout measurements do not need to reference datum(s). They purely check for how flat a manufactured surface is.
Below we can see that the desired tolerance value based on the GD&T callout is .008” total tolerance (or +/-.004”) and after placing the callout, we can see that this dimension passes by being just .0039” Out-Of-Tolerance or +/-.0019” out from nominal. But how does the surface itself really look? Where is the loss of flatness? Did the part pull up from the vise during machining? Was the federate too fast causing the tool to deflect? Which areas of the face were contributing to the tolerance conditions? That’s where the color map fitting capabilities come in. Below is the callout without color map fitting turned on. We know the results, but where specifically is the Flatness the worst?
Now with color map fitting deviation turned on, we can dial in specifically how the manufactured surface looks as compared to the nominal CAD model.
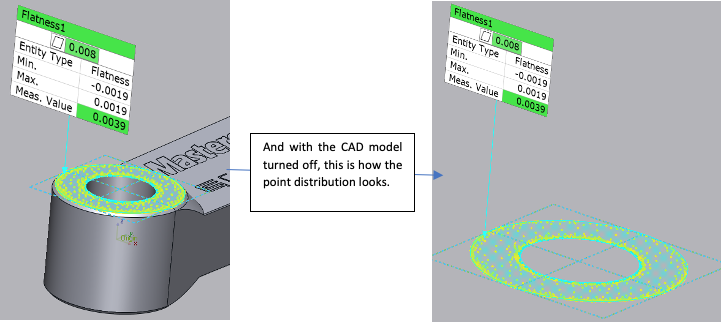
The light blue indicates those points that are slighter undercut (on the low side of the tolerance) from the nominal surface and the yellow shows the points that are full from the CAD face. Perhaps the face mill was small in size and was ‘pulled-inward’ during a face milling process, causing the flatness to be slightly out. Perhaps using a larger face mill, varying the federate, spindle speed, etc. might provide even a better flatness result for future parts?
More than likely, the scanner caused a slight resolution issue at the internal and external sharp edges of the bored hole and flat face, which likely caused the Flatness to be out in those areas (i.e. the yellow edges). Perhaps a more interesting GD&T condition to consider for color map fitting is Parallelism. For this, a planar datum needs to be specified.
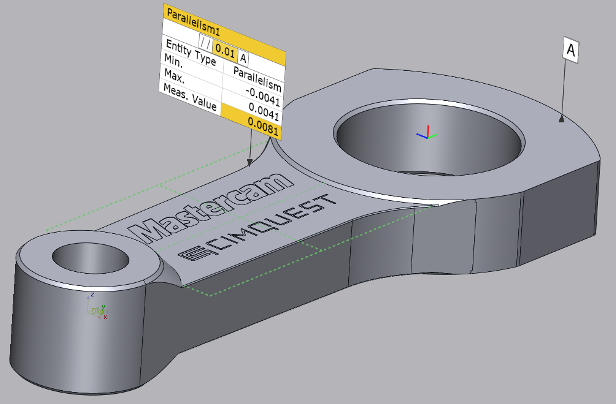
Let’s consider measuring the Parallelism of the engraved face section of the arm as compared to Datum A (see image below). We’d like the result to be Parallel within .01”. We can see from the Control X results below that this tolerance also passes, but is closer to the tolerance limit. Thus the yellow color on the dimensioning text box.
And with the color map fitting tolerance turned on, the Parallelism for the face analysis result looks like this, again with a majority of the data as under but the right-hand corner skewed slightly.
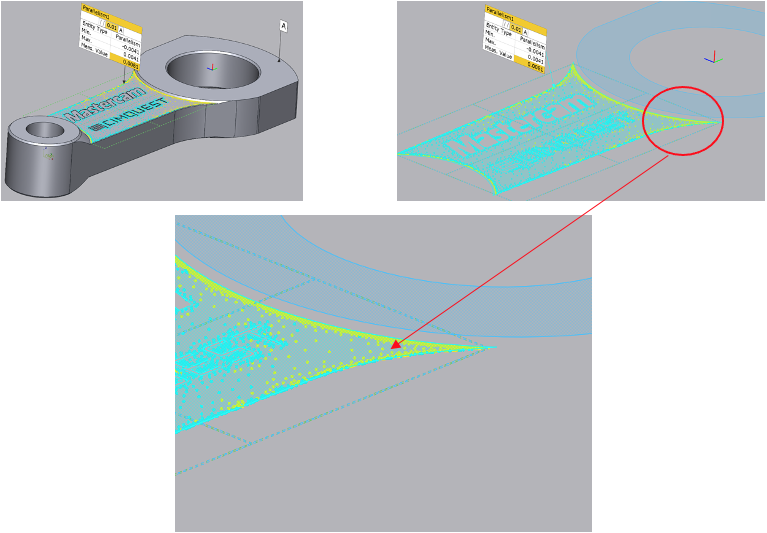
The most significant loss of Parallelism seems to be in the right-hand corner, based on the color map fitting. So pulling up from a vise during machining could have been the cause here. Feel free to reach out to Joel Pollet with any questions or comments.

Leave A Comment