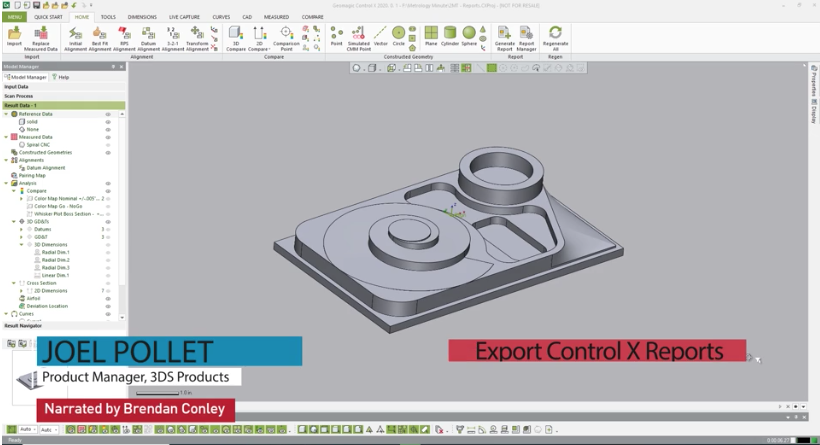
This blog post will explain how to export data out of Control X to be used for review or downstream applications. Control X Metrology software allows you to leverage rich data to understand why parts are in or out of tolerance.
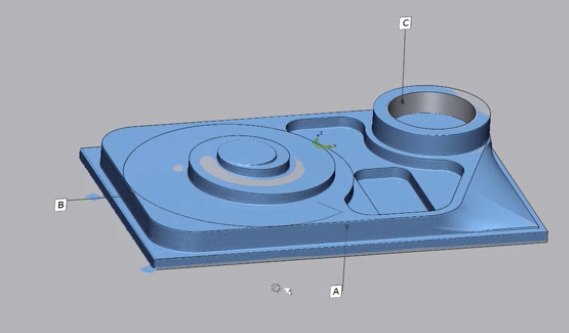
In working with a CAD model, known as the reference data, when you select the reference data node, a window appears in the bottom left that shows how the model will appear in the report.
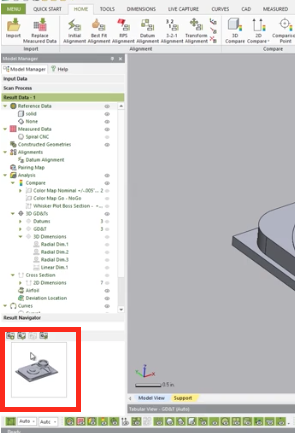
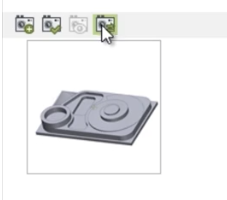
If you want to change the angle, you can rotate the part and simply click as shown below to update the orientation in the report.
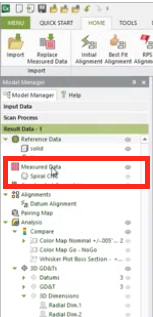
Now let’s move on to the Measure Data, which is the actual scan data.
For Datums, there are three datums to fins, two flat faces of A and B, and datum C for the cylinder.
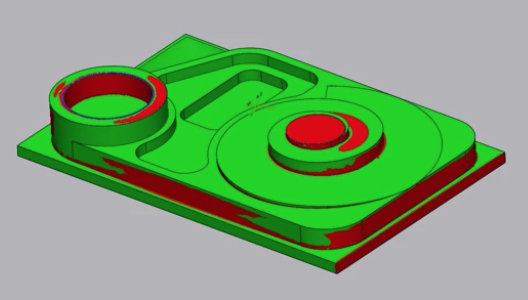
Under Compare, there are multiple color maps including a standard one and then a Go-No Go color map, which simply shows what is inside tolerance and what is outside of tolerance.
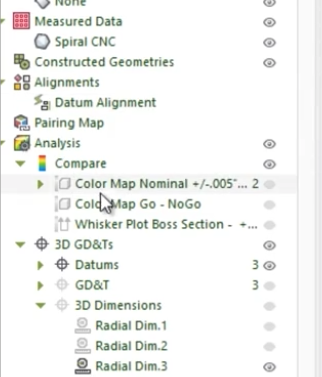
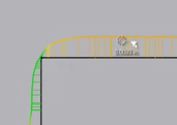
Below we have a whisker plot which is essentially a 2D color map.
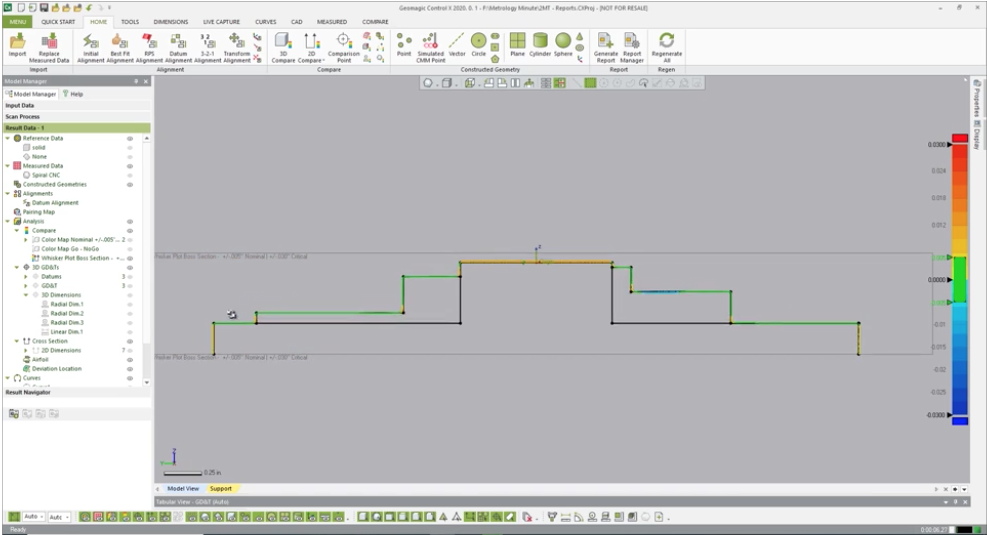
The black line is the exact geometry of the CAD model, and the colors are the cross-sections of the scan.
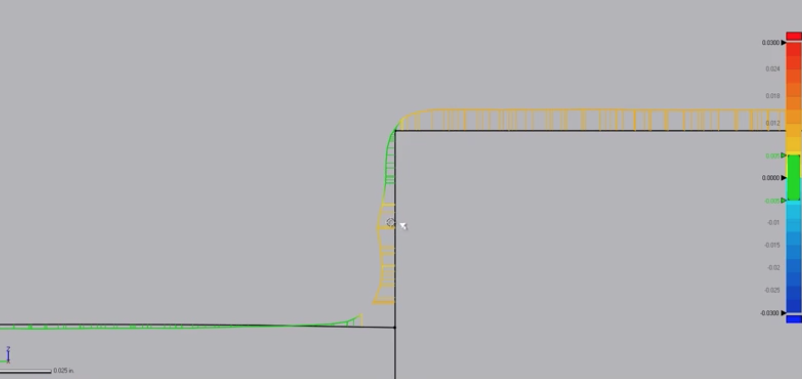
Hovering over the whiskers the system shows the distance that the scan is out. This is a great analysis tool with a very telling image that is easy to read.
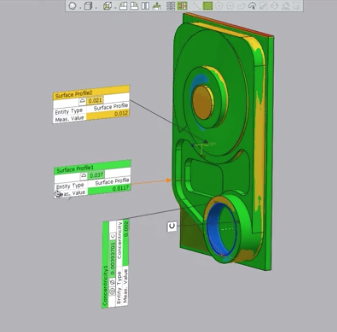
Under GD&T, there are some surface profiles, as well as concentricity.
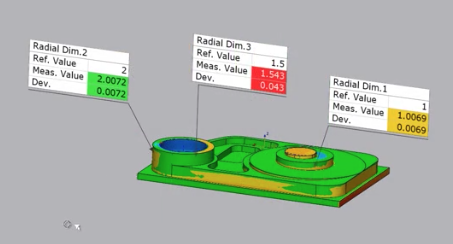
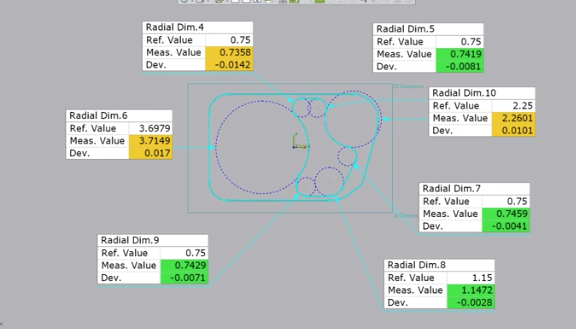
And under 3D Dimensions, there are a few different radia. One is within the pass values, one is in the warning, and one is a failed dimension comparing the CAD model to the scan.
We also have 2D dimensions taking a slice through the model.
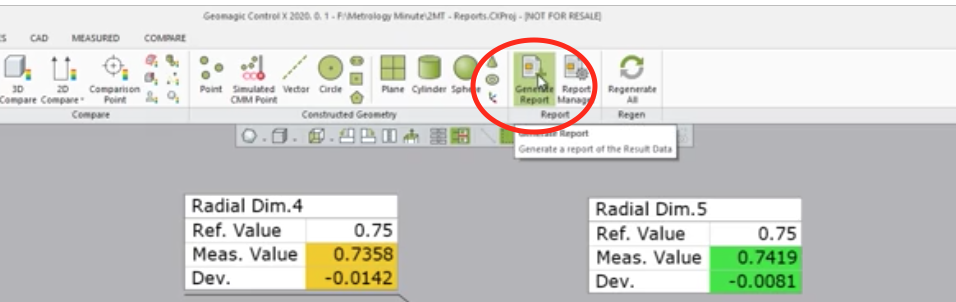
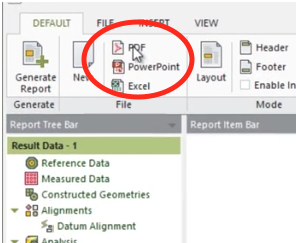
Now you can generate a full report. Just select Generate Report from the top menu.
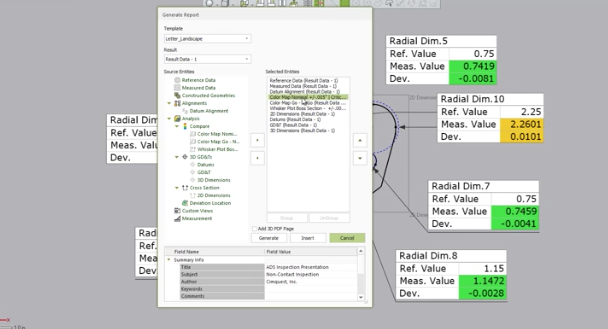
Next, decide which entities you would like to keep in the report. You can rearrange the order and remove anything we do not need.
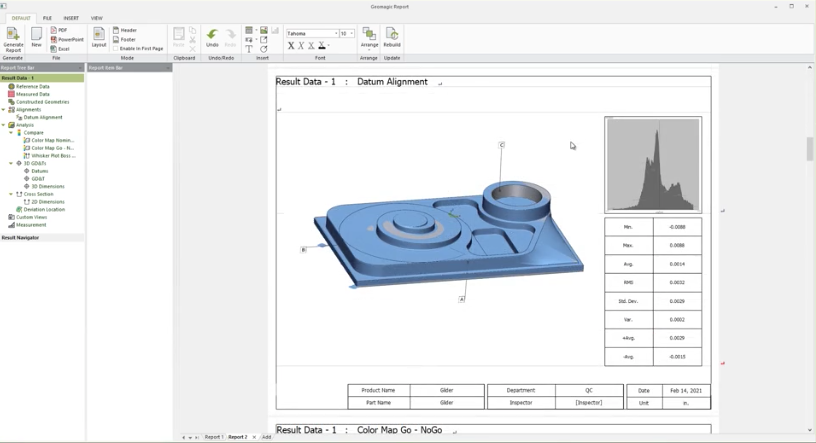
Once the report is written, you have additional editing options. Every image is a graphical image along with a page of the spreadsheet data in text format.
Now you can click PDF to export it, and you will have a clean formatted report that can be sent to the manager or customer.
As you can see, Control X’s reporting tool is an easy customizable way to generate streamlined reports, allowing teams to analyze and make crucial decisions about their parts faster. Please be sure to sign up for our 2 Minute Tuesday video series to receive tips and tricks like this one in video form every week. More info at the button below.


Leave A Comment