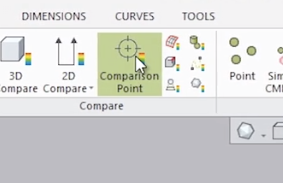
This blog post will show you the Comparison Point Analysis tool which enables a Control X user to click arbitrary or specific point locations on the Reference CAD model and compare them to the corresponding point mapped to the Measured mesh model. This is a very useful comparison tool for identifying the accuracy of random point locations on the manufactured model.
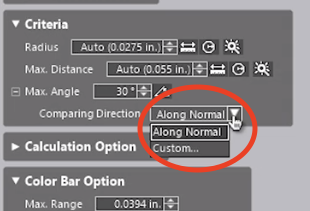
The typical method of mapping points is by using the Along Normal vector option, but custom projection directions may be set.
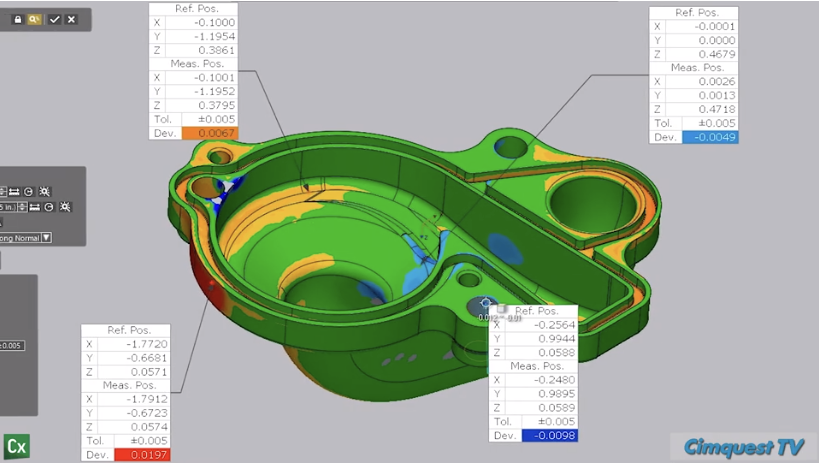
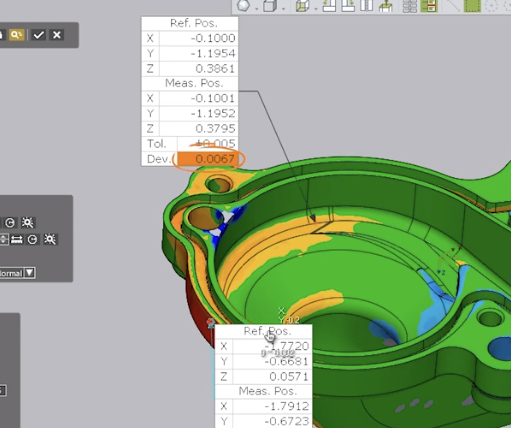
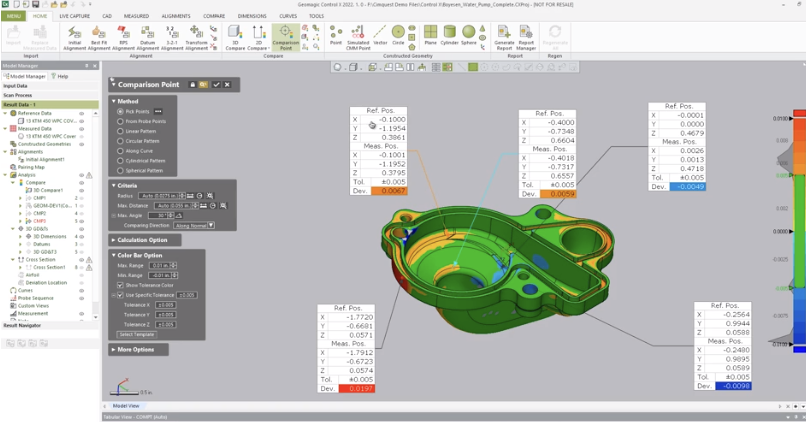
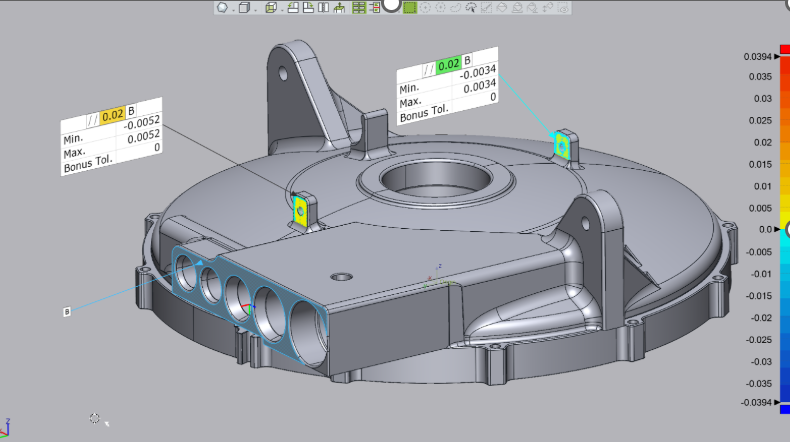
Normally the direction is calculated by radiating from the selected point on the Ref model and projecting normal until the vector hits the Measured model. The length of the vector is actually the Deviation of that point location. The length is displayed in the text boxes you see on the screen from Reference to Measured.
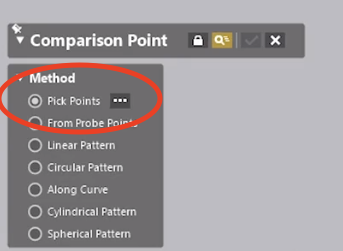
In this example, we can select locations on the model. However, by using the top point selection option, the points to compare can be specific and represented in a text or ASCII file. This is imported using the Pick Points selection option.
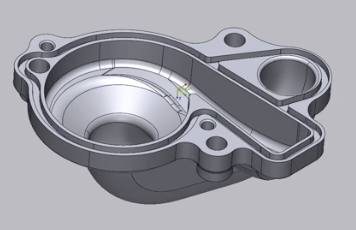
Let’s consider this water pump housing and suppose we wish to analyze random points where the color map shows significant deviation.
It is always advantageous to perform the Comparison Point function with a color map visible on the screen, comparing the mesh model to the nominal CAD model.
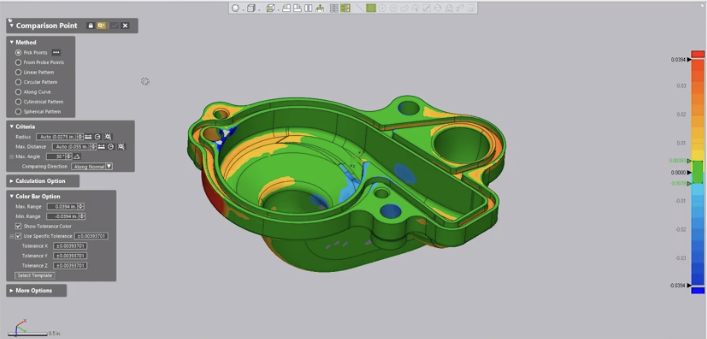
If you can see the color map, you can select critical point locations on the model for the analysis based on both critical part areas and the color map display.
By keeping the Comparison Direction set to Along Normal, the system will calculate the deviation from the selected point of the CAD model to the projected point on the mesh.
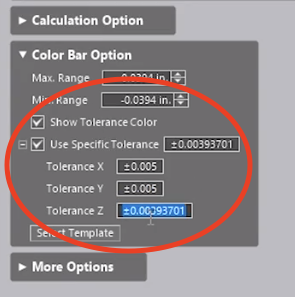
The tolerances may be set in the dialog to check for specific Out-Of-Tolerance (OOT) conditions and locations. Notice how the colors shown for the deviation in the text boxes immediately notify you of a full condition (yellow/orange/red transitions) to undersize conditions (light to dark blue). Negative values show that the scan is “beneath” the CAD model.
As you can see, using the Comparison Point Analysis tool provides you with a very useful way to select specific points of a Reference CAD model and compare them to the same locations on a Measured mesh model. This is especially convenient for checking the accuracy of the manufactured model. Please be sure to sign up for our 2 Minute Tuesday video series to receive tips and tricks like this one in video form every week. More info at the button below.

Leave A Comment