The Comparison Point Analysis tool in Control X lets you to click on arbitrary point locations on the Reference (CAD) model and compare those to the same point, mapped to the Measured (mesh) model. This is a useful tool for identifying the accuracy of random point locations on the model.
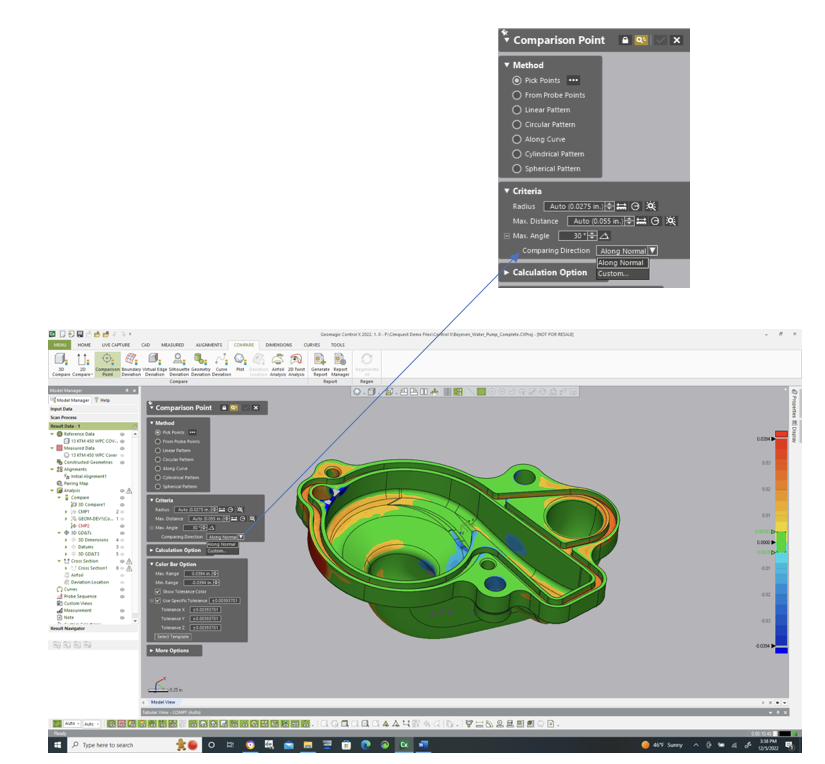
The typical method of mapping a point is using the “Along Normal” vector option, radiating from the selected point on the Ref model and projecting normal until the vector hits the Measured model. The length of the vector is the Deviation of that point location, from Reference to Measured.
In this example, we select locations on the model.
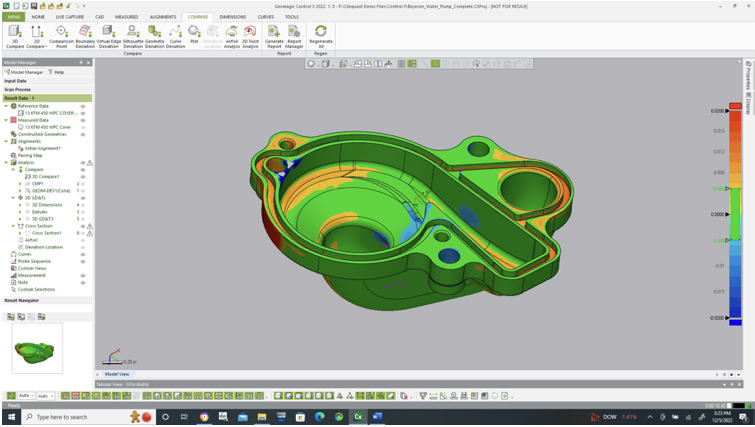
Let’s consider the water pump housing shown below. It is always advantageous to perform the Comparison Point function with a color map on the screen, comparing the mesh model to the nominal CAD model. You can see the color map and select critical point locations on the model for the analysis based on both critical part areas and color map display.
By keeping the Comparison Direction set to “Along Normal”, the system will calculate the deviation from the selected point of the CAD model to the projected point on the mesh.
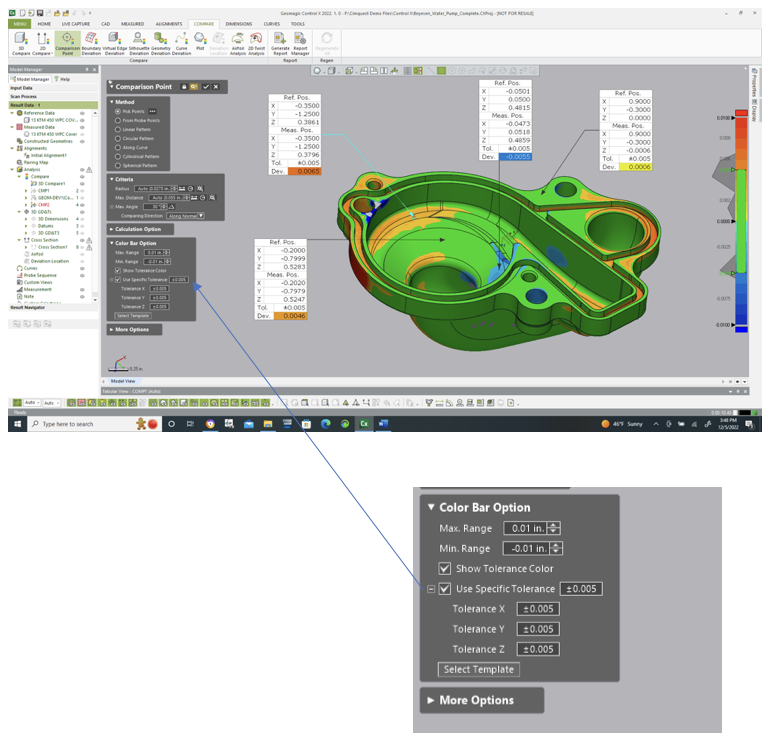
And the tolerances may be set in the dialog to check for specific OOT (Out-Of-Tolerance) values and locations. Notice the colors shown for the deviation in the text boxes immediately notify you of a full condition (Yellow/Orange/Red transitions) to undersize conditions (light to dark blue).
Please contact Joel Pollet with any questions by clicking below.

Leave A Comment