The Control X Plot Comparison Tool will analyze the thickness, curvature, and angle of Measured data (point cloud or mesh) and uses color mapping to display the results. You can also pinpoint specific point locations on the model to return actual values for the plot being reviewed, at those specified locations. One of the unique aspects of this tool is it does not require Reference data. All calculations utilize a single Measured mesh or point cloud for the analysis.
Measuring Wall Thickness
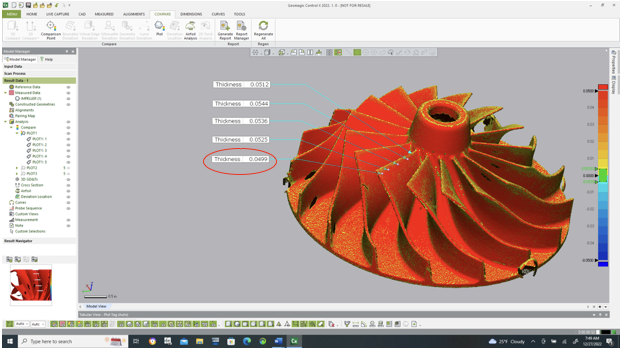
If you want to ensure the top blade edge of the turbine shown below never drops below a .050” wall thickness, you can deploy the Plot tool, and use both color maps and selected points. Control X can return the wall thickness at specified locations.
For the image shown below, the min and max Range is set to +/-.050”, meaning if the color is dark red, the wall thicknesses for each blade is, at least .050” thick. You can see where one of the analysis points near the blade’s edge where the thickness does drop below .050”.
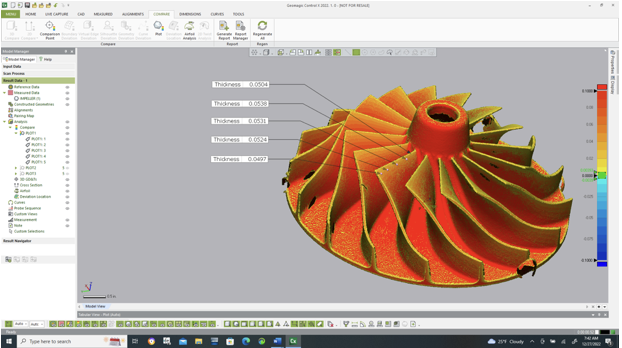
By increasing the Min/Max Range to +/-.100”, you can see how the color map now appears much more revealing as to what is actually taking place. The areas where the blade thins out are easier to distinguish. The color map bar may also be adjusted to better reveal results. In this example, we used a “Ray Firing” method of determining wall thickness by essentially creating a normal vector through the selected point and projecting normal until it hits the first opposing surface.
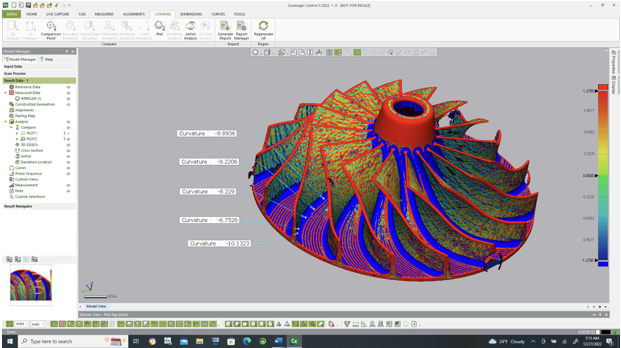
What About Curvature?
Determining curvature for a 2-dimensional curve at any given point is a relatively straightforward process however on a 3D surface, curvature can be challenging to define based upon where it is measured from. There are an unlimited number of curvature values that may be calculated. Control X considers the Min and Max curvature, through a point when measuring 3D curvature.
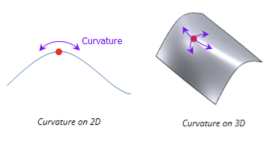
Consider curvature as the deviation from the flat of each section of the mesh or point cloud at any given vertex. This is a very useful tool for inspecting parts having airfoil or other complex, 3D shapes. At each point in the mesh, the curvature is analyzed in 3D.
The Min selection displays the minimum 3D curvature at each vertex whereas the Max displays the maximum curvature at the same point (vertex) location. For clarity, either Min or Max (or Mean) curvature color maps may be shown.
Min Curvature Display
As a reminder, the lower the curvature, the flatter the surface is at any given point location.
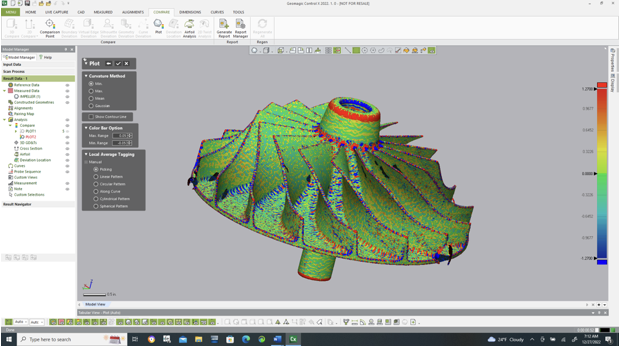 Max curvature display
This plot is a bit easier to interpret as you can clearly see the max curvature at the fillets where the blades meet the hub. By selecting points, max curvature at those selected points is then displayed and captured for analysis.
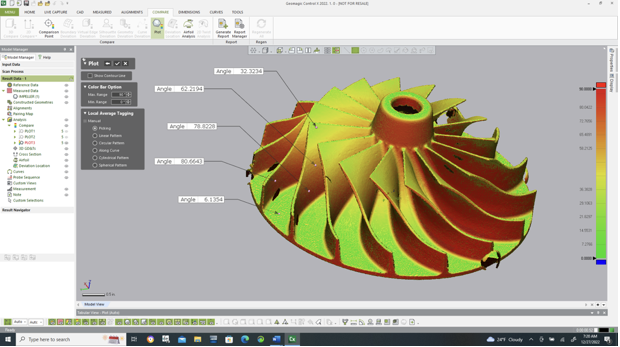
What about the Angle Plot tool?
The Plot Tool can analyze the change in angle in the MEAsured data mesh or point cloud. By setting min and max ranges of 0 and 90 degrees respectively, you can see the flatter vs more angled surfaces of the turbine relative to a Reference Direction, which in our case is the centerline axis of the turbine (0,0,1).
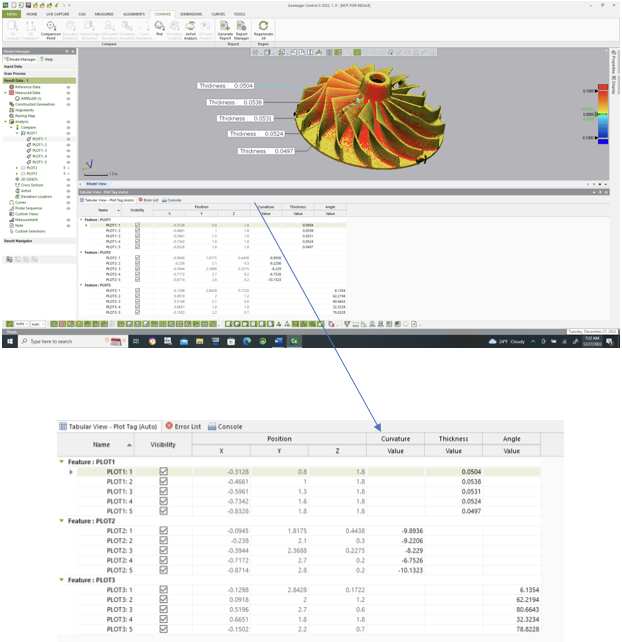
As with all data calculated by Control X, the results for the thickness, curvature, and angle values may also be easily viewed and exported for downstream analysis and usage in other programs.
Please contact Joel Pollet with any questions.

Leave A Comment