Control X is capable of collecting 2D and 3D dimensional information, GD&T information, Statistical Information (RMS Value, Standard Deviations, etc.). More often than not, users are interested in displaying the data in a report, either to be used internally or to be presented to their customers. But did you know that Control X can also make this information available for downstream applications as well?
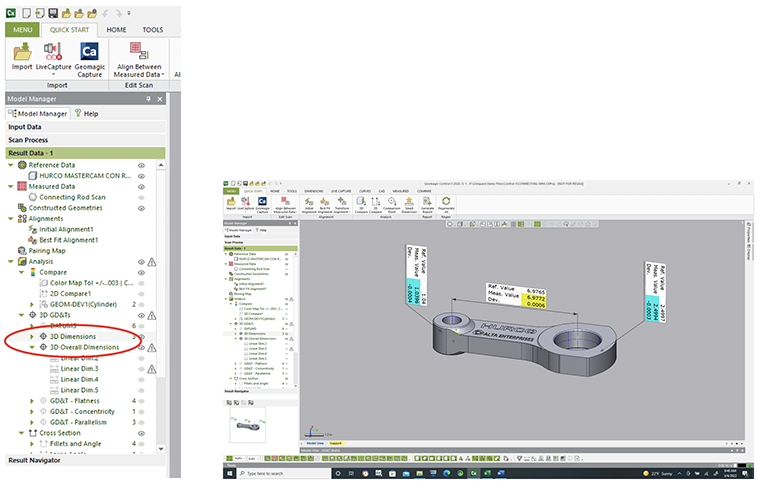
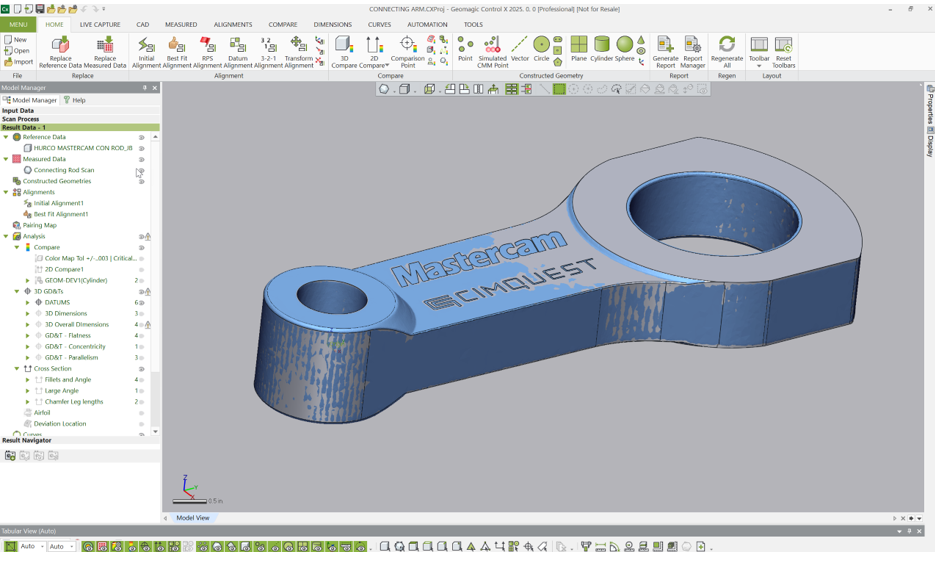
Consider the “3D Dimensions” and the “3D Overall Dimensions” nodes below. The 3D Dimensions GD&T node contains three dimensions.
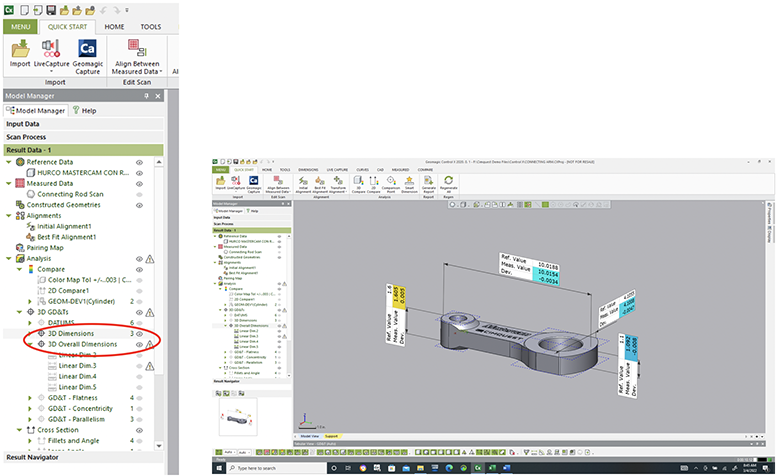
 And the 3D Overall Dimensions GD&T node contains four dimensions.
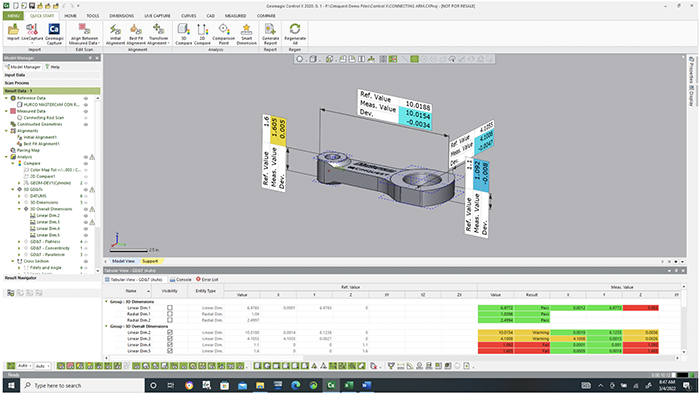
With the 3D GD&T Node selected below, we can preview the data in the form of a spreadsheet, at the bottom of the graphics window. Notice pass/warning/fail information is also clearly displayed, utilizing colors.
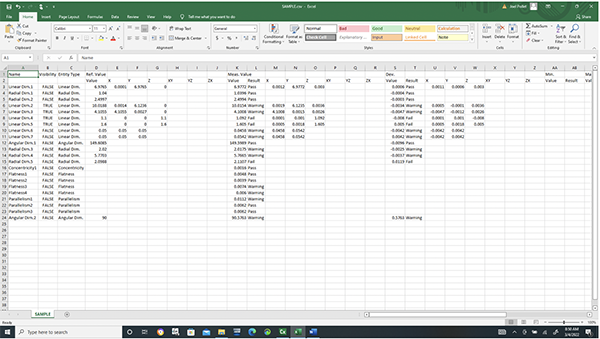
With a quick Export to CSV, the data is readily available in a standard, fully-functional Excel CSV file.
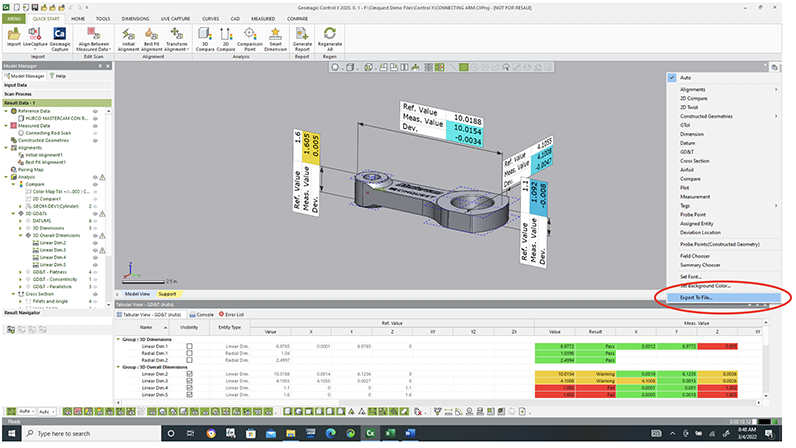
We can then retrieve the CSV file and all dimensional and testing data is available for any downstream applications.
Please reach out to Joel Pollet with any questions or comments.

Leave A Comment