Performing 2D Twist Angle Analysis in Control X
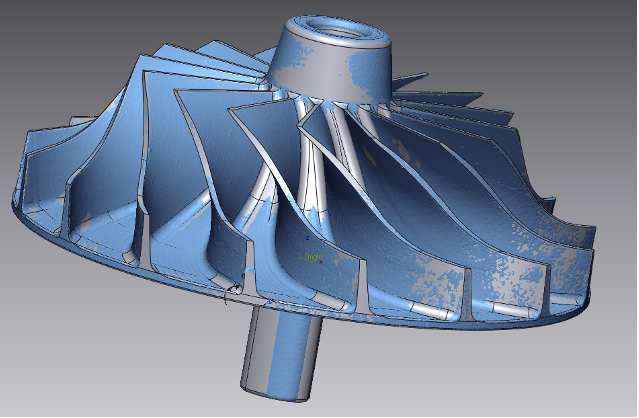
In this edition of our Metrology Minute, we are going to discuss the 2D Twist Analysis tool in Control X. It analyzes the deviation of twist angle between section profiles of the Reference and Measured data. Let’s use the turbine scan, aligned to the nominal CAD model shown below as an example. You would start with a pre-aligned model of Measured to Reference data.
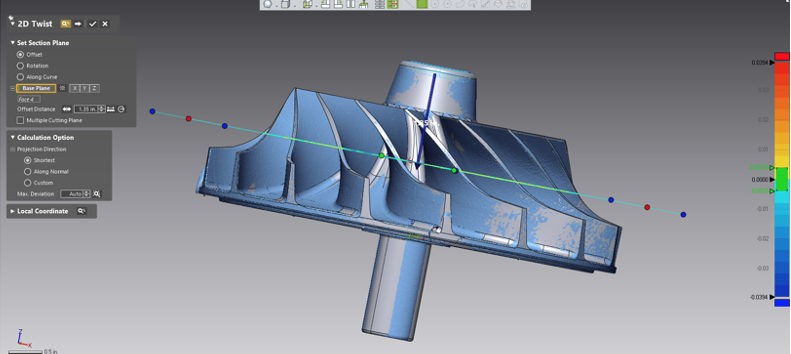
If you want to perform a 2D Twist Analysis on the blades using a section taken roughly centered through all of them, you would pass a plane, normal to the centerline axis of the turbine, through the rough center of the blade surfaces. The cyan curve represents the section plane to be used.
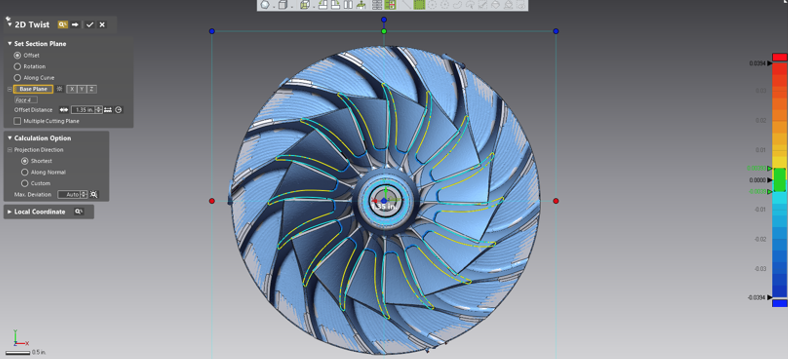
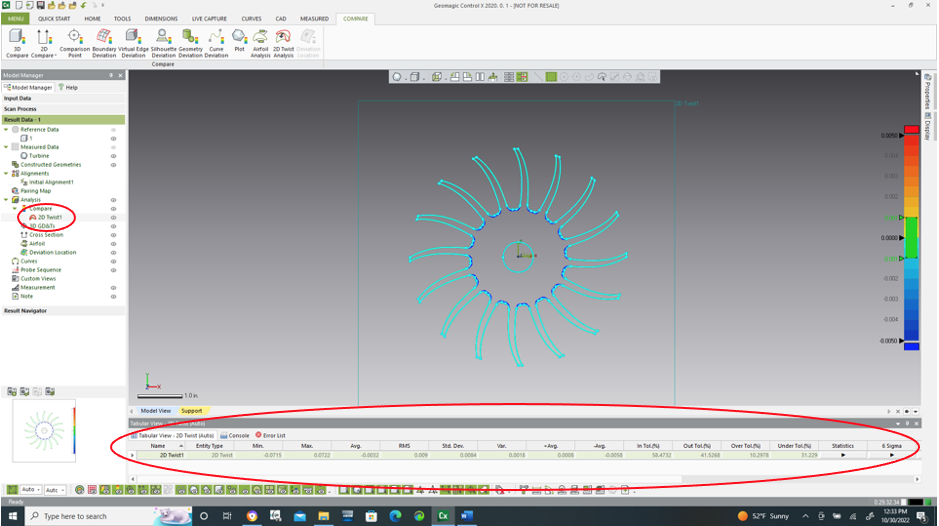
Looking down the centerline axis, you can see your “2D Compare-like” section, comparing the nominal CAD model to the scan.
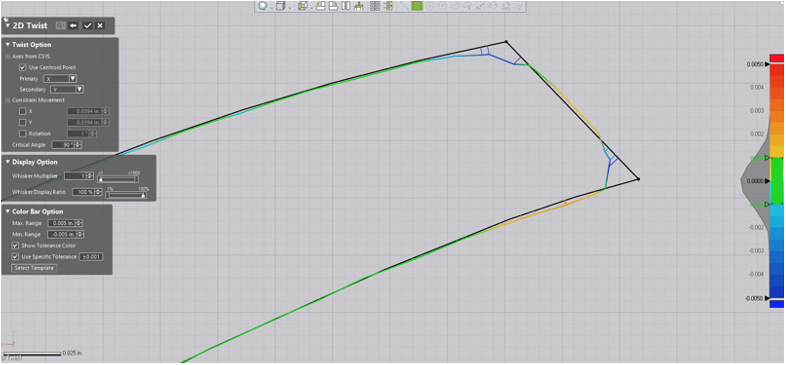
Turning off the solid model and mesh provides a clear picture of the 2D Twist Whisker Plot.
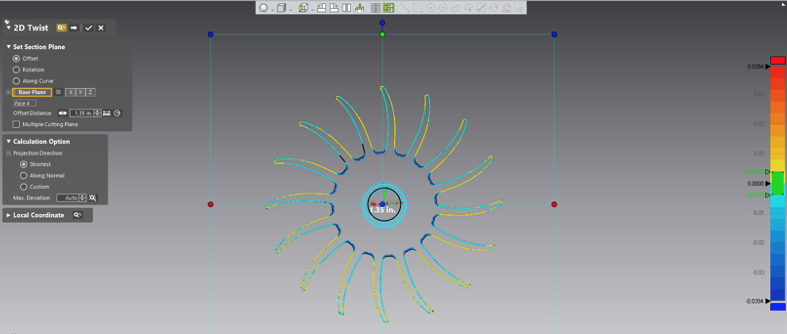
By setting the specific tolerance, as well as the Min and Max Ranges, we can have Control X calculate the planar twist at this selected planar location for each of the blades in the turbine.
By zooming in, you can get a clear look at the Whiskers and derive how much the blades have twisted based on the nominal position with the assumption that the twist direction is normal to the blade’s cross-section.
The 2D Twist information is reported in the Compare node in Control X and may be exported to a CSV file or displayed on the bottom of the screen, as well as exported to a final inspection report.
Please contact Joel Pollet with any questions.


Leave A Comment