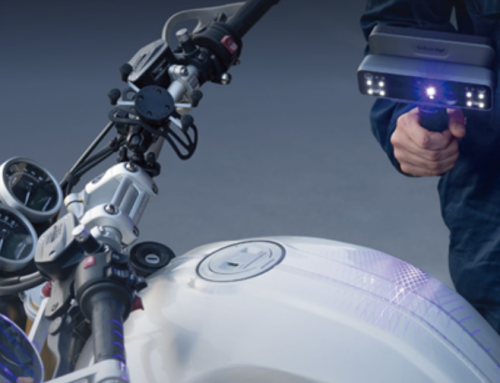
Today we will discuss how to analyze various trends of inspection results. The non-contact inspection world is ever growing. More and more companies are using metrology grade scanners to inspect their product. This allows them to utilize the scans and check geometric dimensions and tolerances, extract 3D deviation color maps, and quickly generate full-color 2D and 3D PDFs.

But what if you wanted to take this even further and analyze trends based on your inspection results? This is exactly what Geomagic Control X software is able to do.
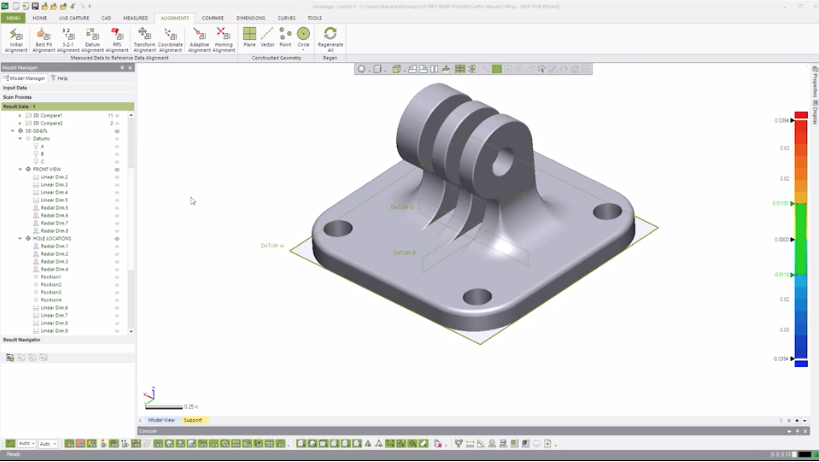
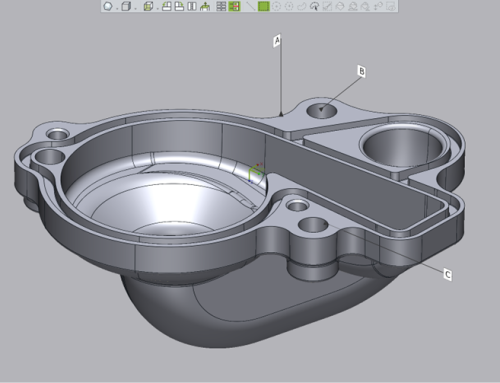
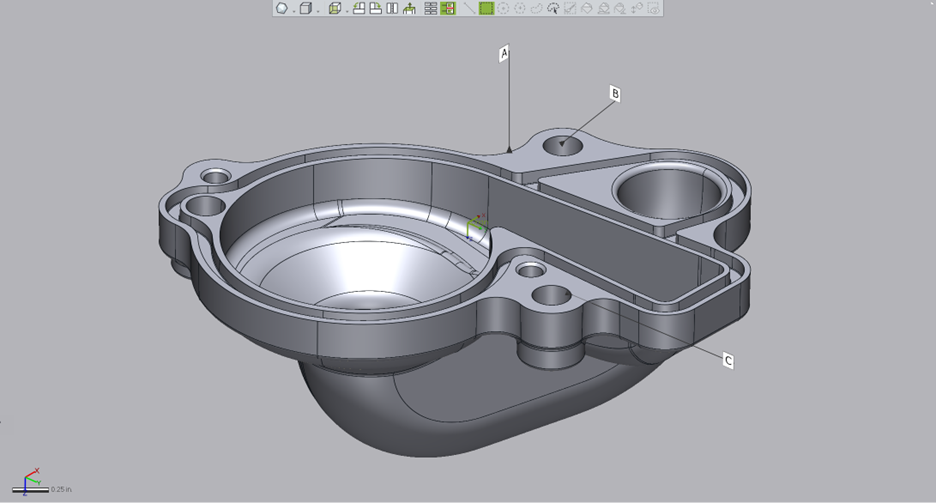
Shown above is a GoPro mount that we designed in-house, and the goal is to track the length, width, and a few other critical dimensions of the manufactured part. At this point in time, we have already scanned and processed them in Control X and produced an XML file for each.
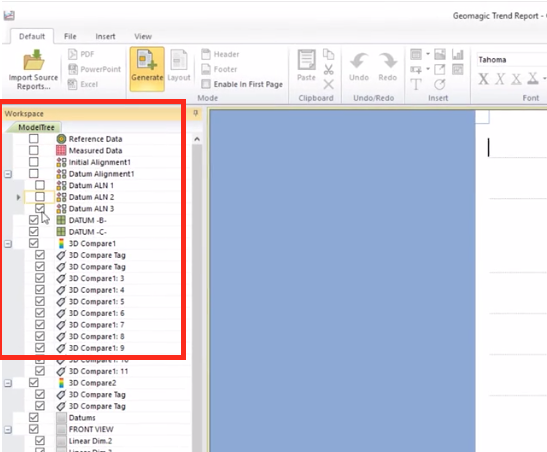
From here, we are ready to open the Trend Report application. After selecting the source reports, choose the entities that you want track or report, whether it’s a linear dimension, geometric tolerance, and so forth. Statistical data is then generated for each entity.
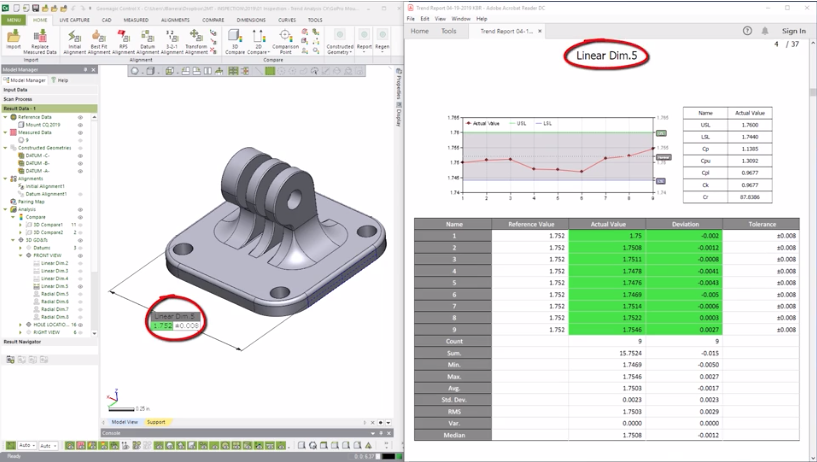
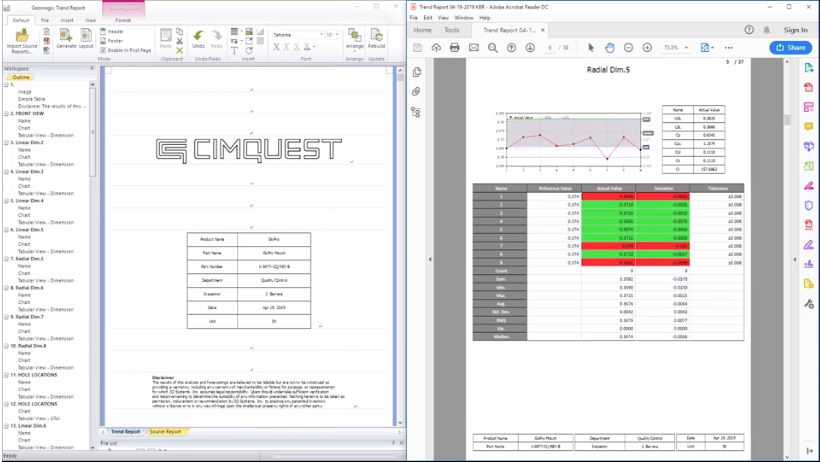
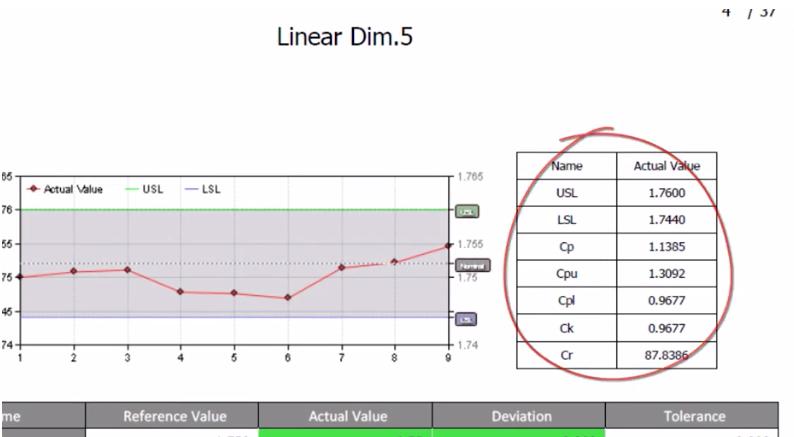
For example, if you analyze the trend for a linear dimension, the first chart will show the upper and lower control limits and how each scan measures up.
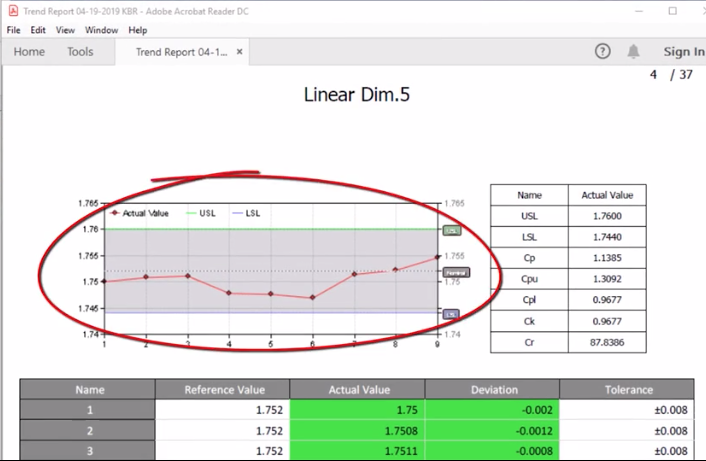
Below you see a table that provides process capability values.
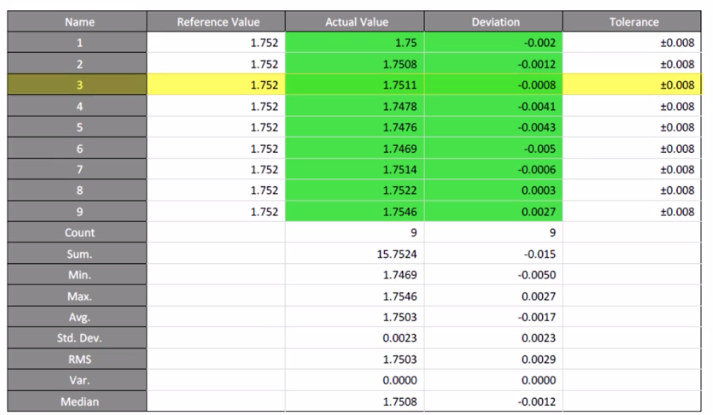
Here you can see a tabular view of the entity in respects to each scan.
As you can see, by quickly scanning through each page, you can obtain insight as to how your dimensions and tolerances are varying from part to part, and can then make decisions as to when corrective action needs to be made in my manufacturing processes. Please be sure to sign up for our 2 Minute Tuesday video series to receive tips and tricks like this one in video form every week. More info at the button below.

Leave A Comment