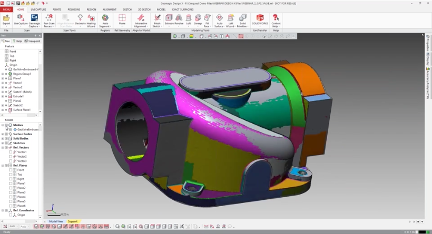
Let’s take a look at the basics behind Deviation Analysis in Design X. This is an essential tool for reverse engineering and will ensure that you get the most out of your 3D scans.
In Geomagic Design X, Deviation Analysis tells us how far off our derived CAD model is from our scan.
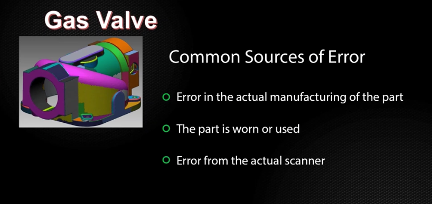
There are typically three sources of error when scanning a part:
- There could be a slight error in the actual manufacturing of the part, whether it was machined, molded, welded, or made in some other fashion.
- The second error could be that the part is worn or used.
- There could also be an error from the actual scanner.
When reverse engineering, it is important to consider if you want to reverse engineer to your design intent, or simply reverse engineer as is.
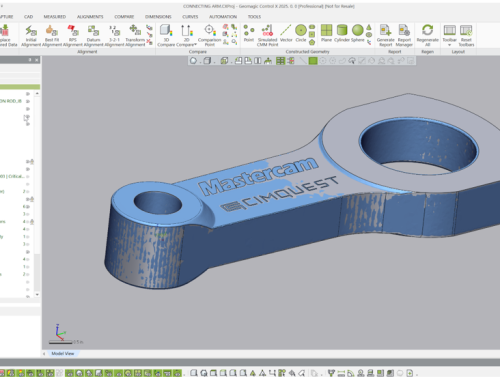
For example, the scanned cylinders’ diameter may show up as 1.999827 inches. But in most cases, you would typically want to correct the specifications to 2 inches.
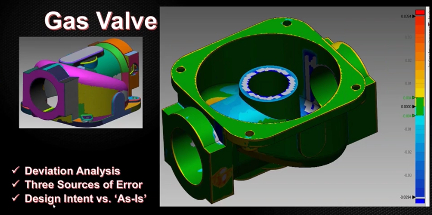
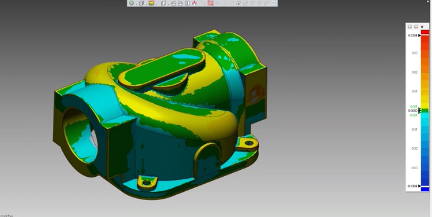
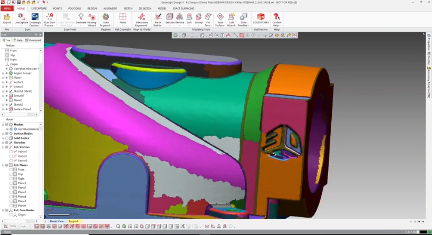
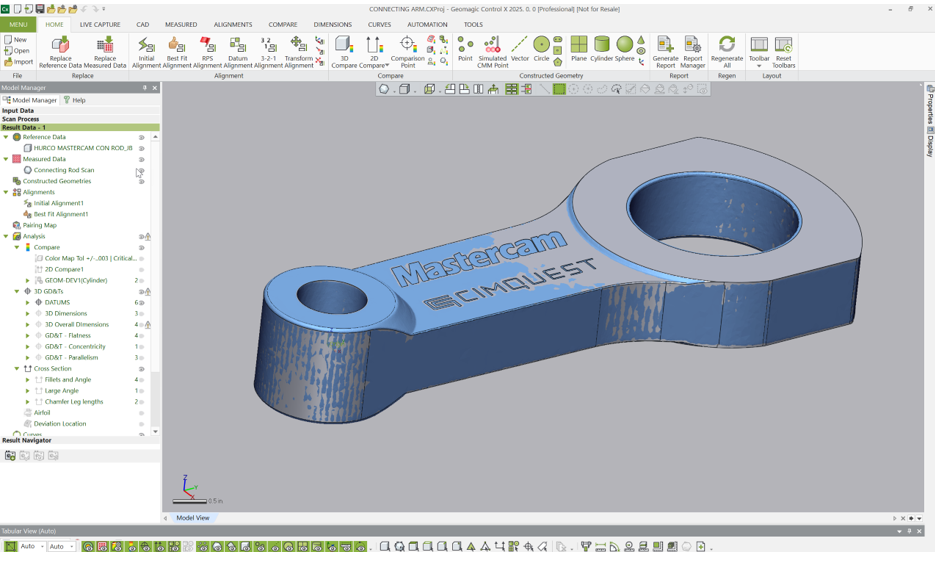
In this gas valve example below the derived solid model was created from a scanned mesh. You can navigate to the Deviation for body tool. Everything you see in green is within +-4 thousandths of an inch of the scan. The reason you see the edges off is due to the scanner’s resolution.
Resolution is the ability to pick up fine detail and scanners typically cannot see sharp edges, so in this case, you see tiny chamfer fillets on some of the edges.
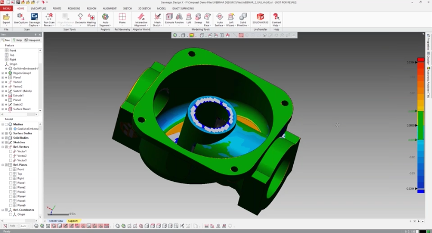
If you tighten the tolerance to one-thousandth, you can see how the color map will change dramatically, with far fewer faces within tolerance.
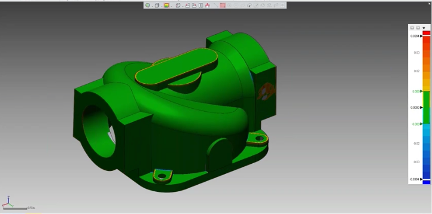
Similarly, if you loosen it to +- 9 thousandths of an inch, you will see the majority of the derived CAD model matches the 3D scan.
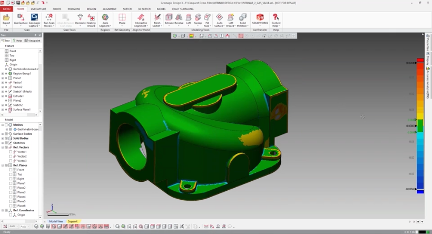
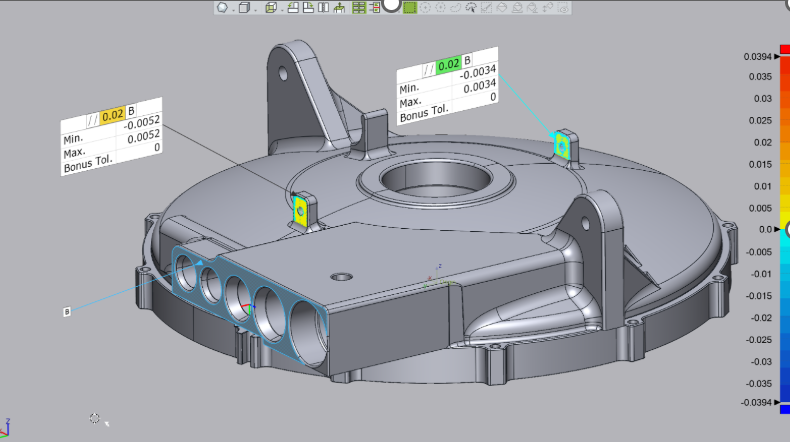
Where you see colors going to yellow or red, that means the model has more material than the scan. And conversely, from light blue to dark blue is the reverse phenomenon – less material from scan to CAD model.
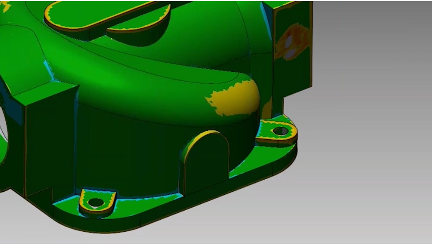
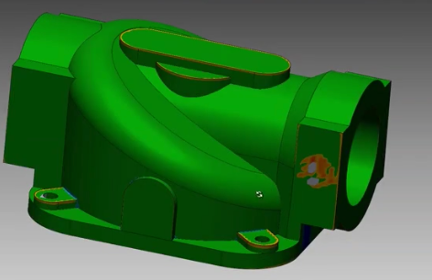
Prismatic shapes usually get a good fit depending on how worn a part is. The deviation here was the logo on the original part. But we did not reverse engineer this in the model which is why we see the yellow and red colors.
As you can see, deviation bars and color maps are very handy for reverse engineering. They allow you to assess the accuracy of a scan and determine the steps necessary to make sure you reach your tolerances. Please be sure to sign up for our 2 Minute Tuesday video series to receive tips and tricks like this one in video form every week. More info at the button below.

Leave A Comment