(Reprint from Cutting Tool Manufacturing magazine.)
Those who track productivity and machining performance are likely familiar with the concept of price versus cost of use. Despite their familiarity, though, when they talk to a cutting tool vendor about price, their reaction often is “Yikes, that tool is expensive!” They react this way because they don’t understand how tool performance affects the true cost of machining a particular part.
Many expensive cutting tools have been engineered for high efficiency. When programmed to follow optimal CAM toolpaths and matched to a machine tool’s capability, they may offer total-cost-and-performance results that are significantly better than lower-cost cutting tools.
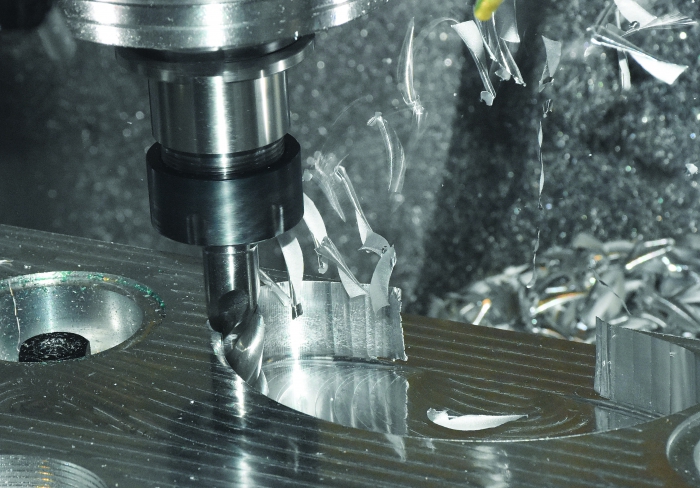
Unlike traditional, offset-based toolpaths, newer toolpath strategies and technology can help keep machining performance at an optimal level. All images courtesy of CNC Software.
At our manufacturing lab, CNC Software Inc., Tolland, Conn., conducted tests comparing cutting tool prices and actual productivity costs. We wanted to discover if preconceived notions we hear about cutting tool costs were true. One notion is that productivity results for an expensive tool will be essentially the same as a cheaper tool.
We selected four solid-carbide endmills, cutting a sample part made from a familiar yet challenging material. To maintain a level playing field, we chose tools for cutting ISO P group steel and initially used the cutting parameters for surface speed (in sfm) and feed per tooth (in ipt) recommended by each tool vendor. We used Mastercam Dynamic toolpaths to ensure and maintain a consistent chip thickness throughout the cutting tests.
We chose D-2 tool steel with a hardness of 31 to 32 HRC as the workpiece material. Its dimensions were 16″×24″×2″ (406.4mm × 609.6mm × 50.8mm). We designed a test part that would maximize the volume of material removed and incorporated various part features.
We also chose a 3⁄8″ (9.5mm) tool to maximize in-cut time for the volume of material to be removed. The tools varied in price, but we stayed within about a 25 percent differential between the highest- and lowest-priced tools. The tools ran at the same WOC (15 percent) and a DOC about 1.5 times diameter, or 0.500″ (12.7mm), even though the most expensive tool was capable of machining at 2 times diameter.
Our goal was to measure tool life, in-cut cycle time and material-removal rate when machining the same part. We wanted a method customers could use to measure performance, make decisions affecting job profitability and determine which cutting tool provided optimal cost performance.
We chose a $100 machine-burden rate and calculated costs based on removing 1,000 cu. in. of material, letting us extrapolate cost performance over a full run of parts.
Based solely on tool price, tool D, at $87.80, was the best choice (see chart on page 33). Based solely on mrr, tool A, at $112.87, was best. We used mrr to calculate the total amount of machining hours needed to cut 1,000 cu. in. of material using each cutting tool. Factoring in both tool and machining costs, tool A proved to be the best performer, at $1,025.43, compared with $1,620.89 for B, $1,737.41 for C and $1,772.45 for D.
The recommended speeds and feeds varied from tool to tool. Recommendations for the lower-cost tools were conservative compared with the pricier and top-performing tool. The lower cutting parameters certainly influenced the final mrr of the lower-cost tools. However, we believed we could use Dynamic Motion to run these tools more aggressively, knowing we could keep the tool in a safe cutting condition and maintain a consistent chip.
On the less expensive tools, the ipt seemed low at 0.0020 (0.0508 mm/tooth) for tool B, 0.0012 (0.0305 mm/tooth) for C and 0.0014 (0.0356 mm/tooth) for D. Also, the surface speed recommendations were 425, 325 and 300 sfm (129.5, 99.1 and 91.4 m/min.) for B, C and D, respectively. Of all the tools, tool A had the most aggressive recommendations: 0.0025 ipt (0.0635mm) and 600 sfm (182.9 m/min.).
For the next benchmark test, all tools were run at tool A’s recommended surface speed and feed per tooth. We then measured tool life. Interestingly, tool life did not degrade much at all except for tool C.

For a run of 250 parts with the new aggressive speeds and depths that Dynamic Motion toolpaths encourage, the actual performance for tool A was nearly $7,500 better than the next best tool.
With the cutting parameters equalized, the mrr was 2.4 cu. in. for all tools. Therefore, the total time needed to machine 1,000 cu. in. of D-2 was the same for each tool, as was the calculated machining cost. The difference among the cutting tools came down to tool life. With total tool costs applied, tools B, C and D were moving closer in cost performance to tool A.
What happens when the cost performance is applied over 250 parts? Suppose a part needs 50 cu. in. of material removed, so the total material removal for the job is 12,500 cu. in. The actual tool cost difference for tool A becomes about $2,435 less than the next closest tool.
How did that happen? We increased speeds and feeds above recommendations for the other tools, which performed relatively well from a machining and cost-performance standpoint. Why weren’t cutting recommendations higher? Toolmakers like keeping tools safe and may not factor in the potential use of contemporary toolpaths.
However, these newer toolpath strategies and technology can help keep machining performance at an optimal level. For example, when a consistent chip thickness is maintained, programmers can drive a tool harder and faster with less worry. This was happening in our tests.
Now, suppose the cutting parameters for tool A (the $112 tool) were also on the conservative side? To find out, we increased sfm to 750, dropped step-over from 15 percent to 10 percent to help improve tool life and increased DOC to 0.75″ (19.05mm), or 2 times diameter.
We could’ve gone much higher, but we wanted to see the results of this moderate increase. Our original cost-performance number for tool A was about $1,400. With the added performance, that cost performance rate dropped to about $1,000 to machine 1,000 cu. in. of material—a significant productivity gain and cost reduction.
Once again, what happens when the new cost-performance numbers for tool A are applied to a run of 250 parts, where 12,500 cu. in. of material is removed? As the chart shows, the actual performance for tool A was nearly $7,500 better than the next best tool. That’s a huge gain in productivity and profitability.
Cutting tool cost isn’t just about tool price; it’s about tool cost performance. Measuring tool performance is key to making an educated purchasing decision.
For information on the Mastercam line of CAD/CAM products, please click the button below.


Leave A Comment