Exporting Airfoil Analysis Data to a Spreadsheet Using Control X
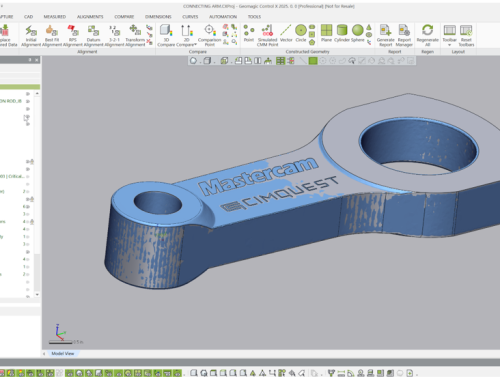
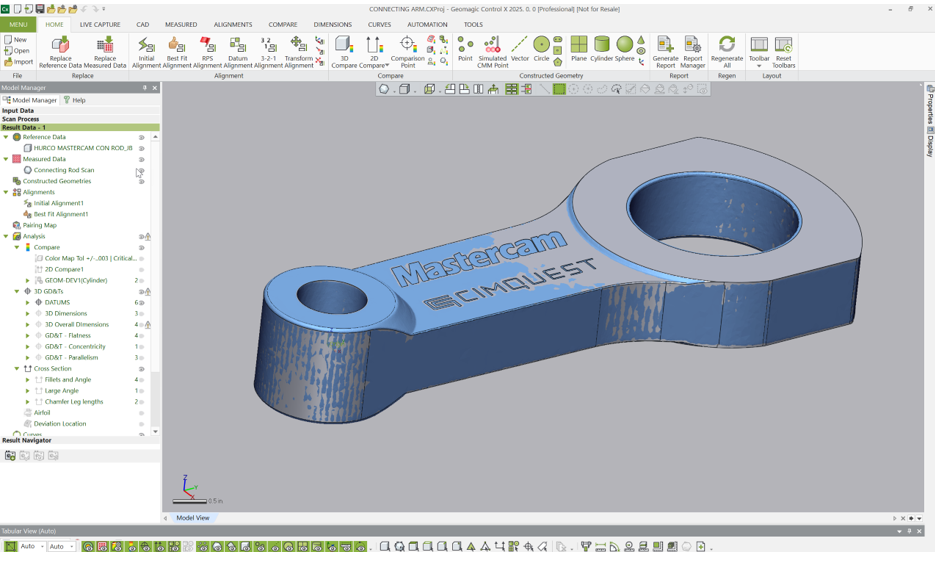
When working with Control X, you often find yourself needing the data that is generated by the software to be exported in a usable form rather than just a static report. In this post, we are going to show you how we analyzed a machined airfoil. Using this machined airfoil below as an example, suppose we wanted to analyze its contour directly at the end face.
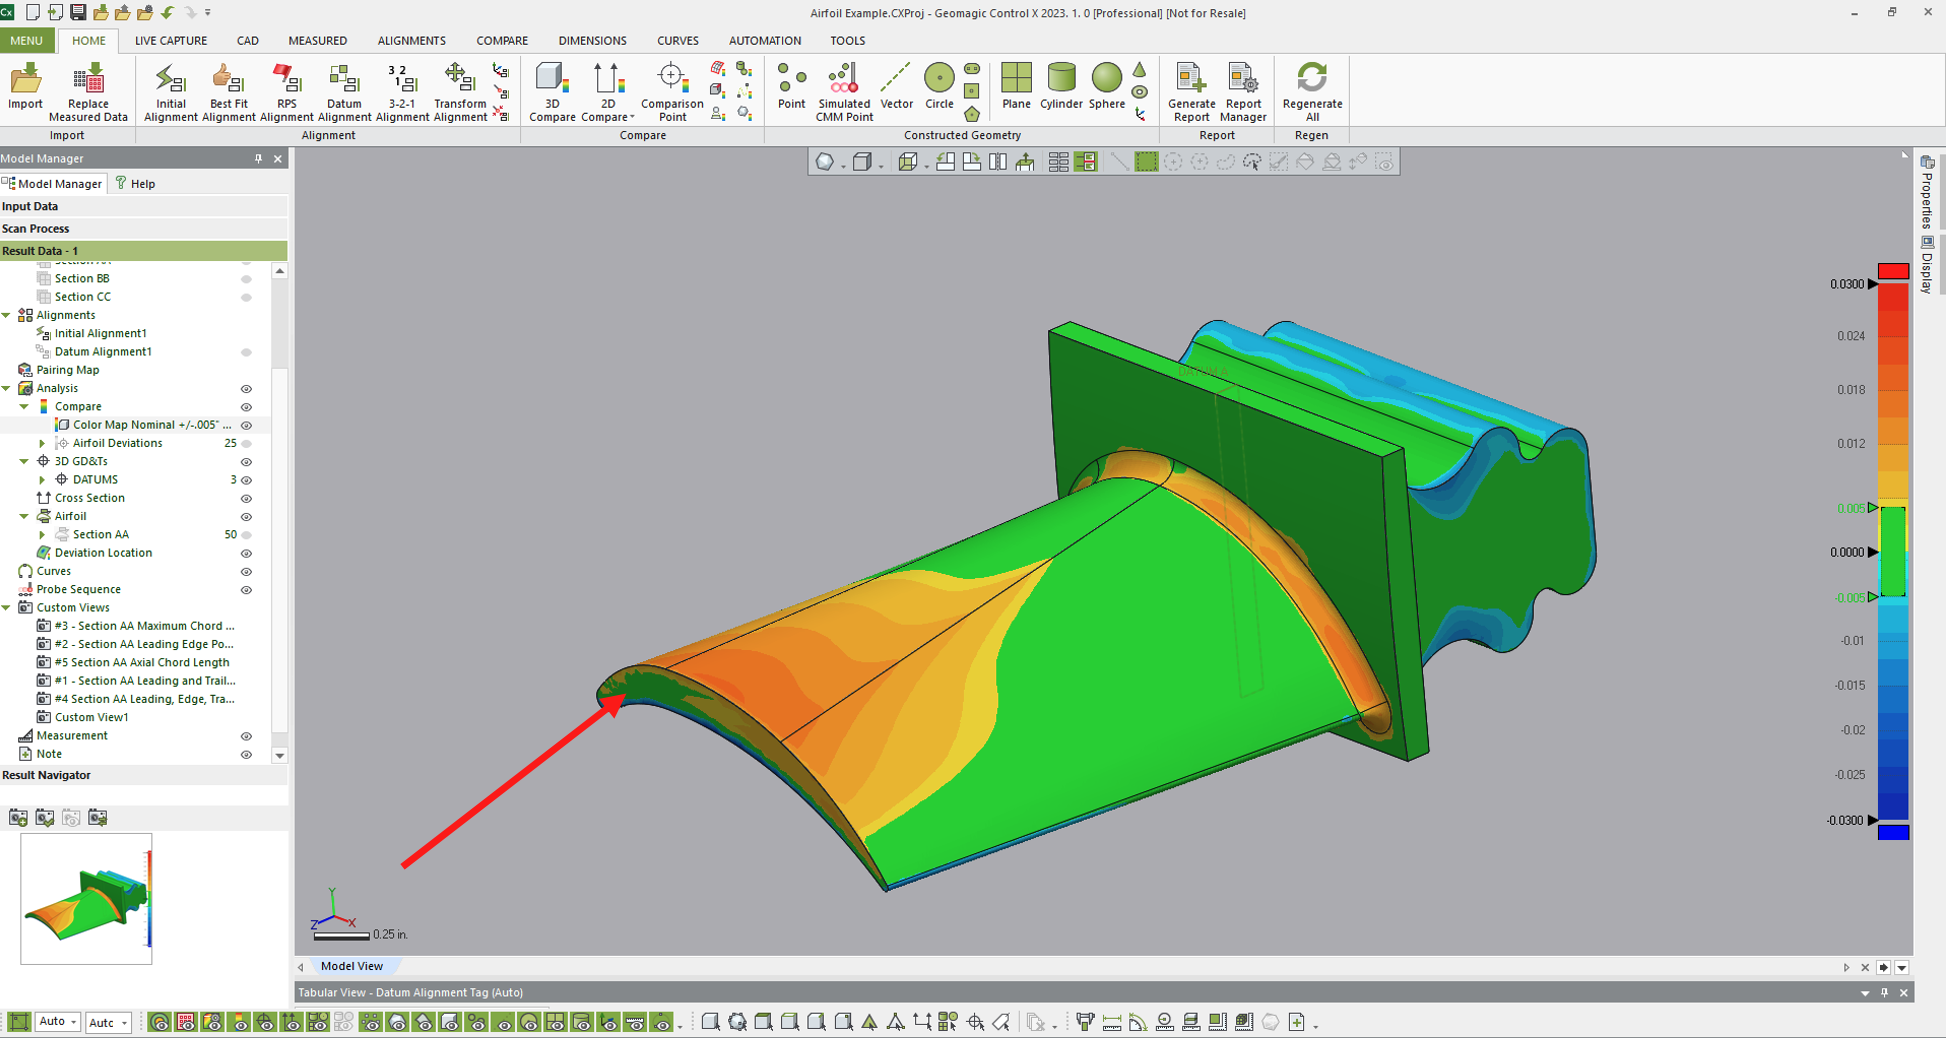
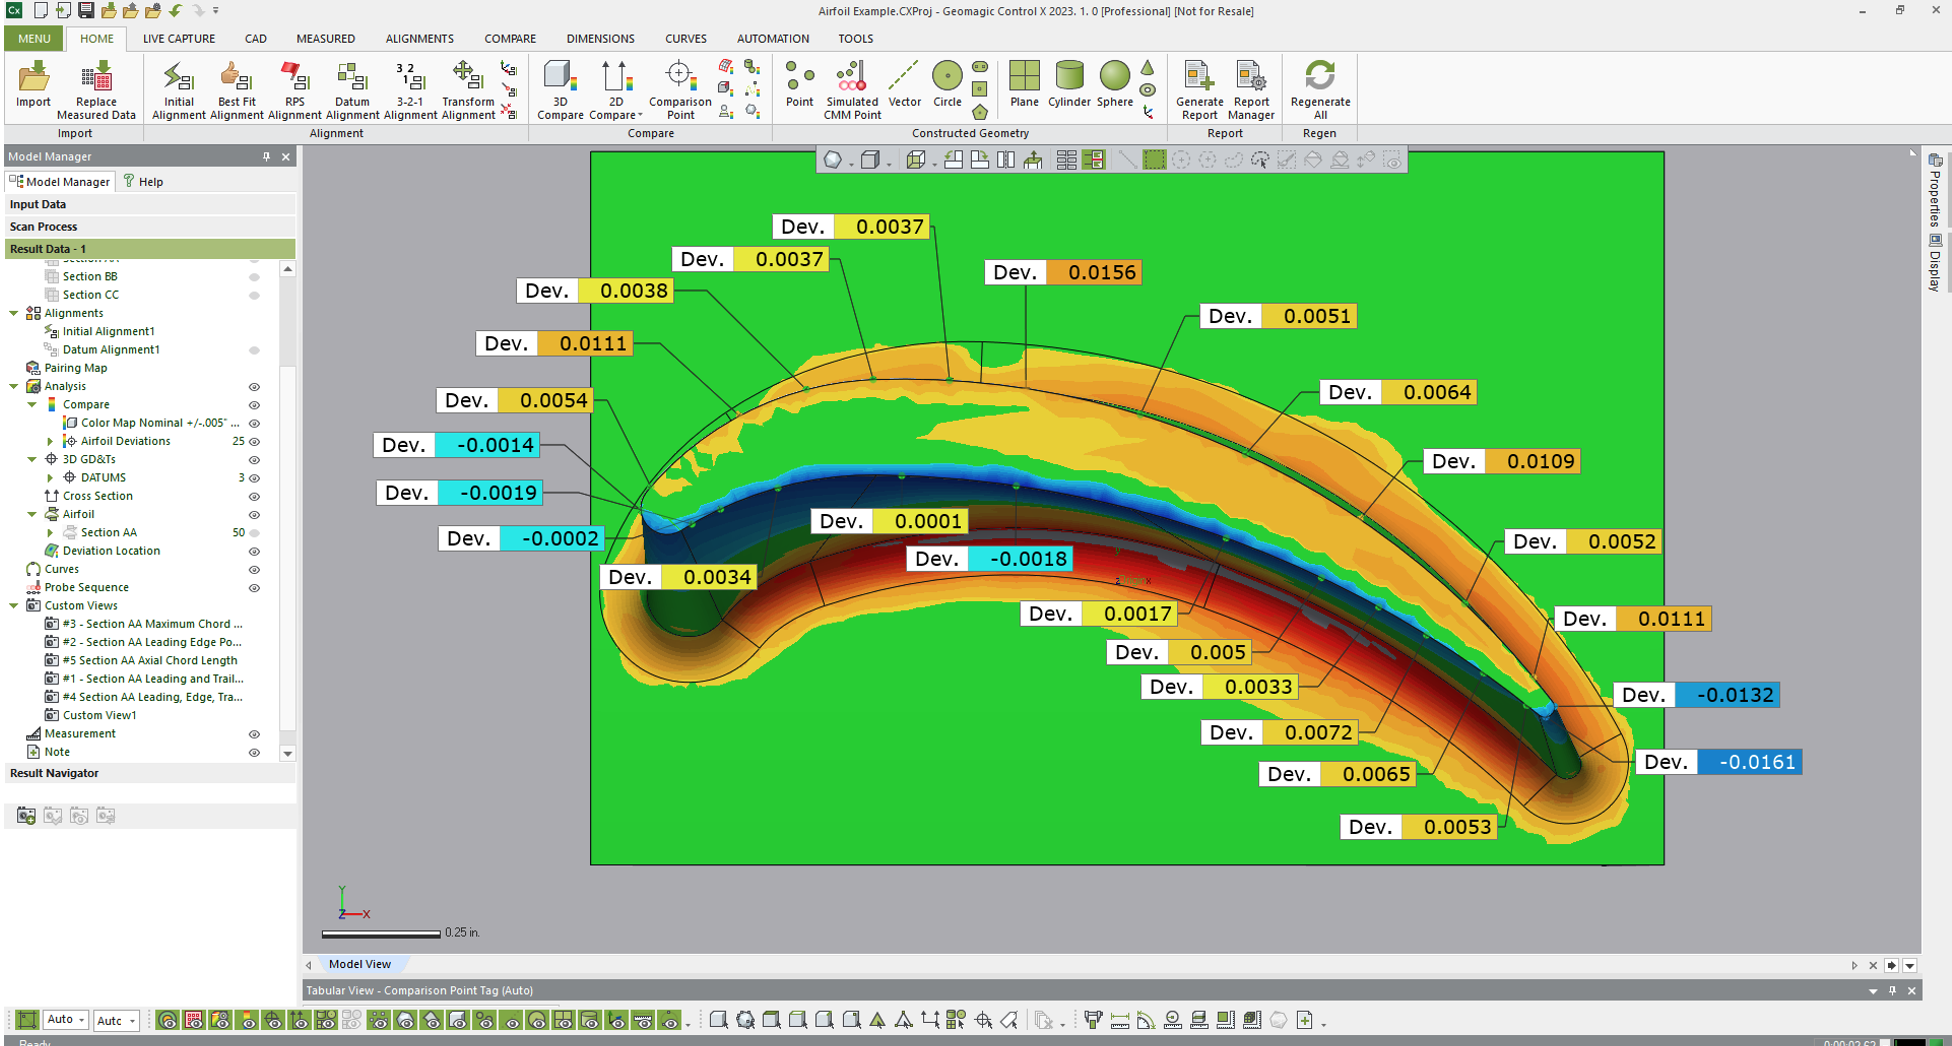
We first would need to complete a deviation check at random points along the outer perimeter. We could use the Comparison Point tool in Control X to select random points along the area of interest to generate the required data.
The color coding allows us to see where the airfoil contour is “full” from the nominal CAD model as well as where it is “undersized.” The Yellow/Orange/Red colors exported from Control X indicate full conditions whereas the light blue – dark blue colors show that the scan is undersized, as compared to the nominal CAD model.
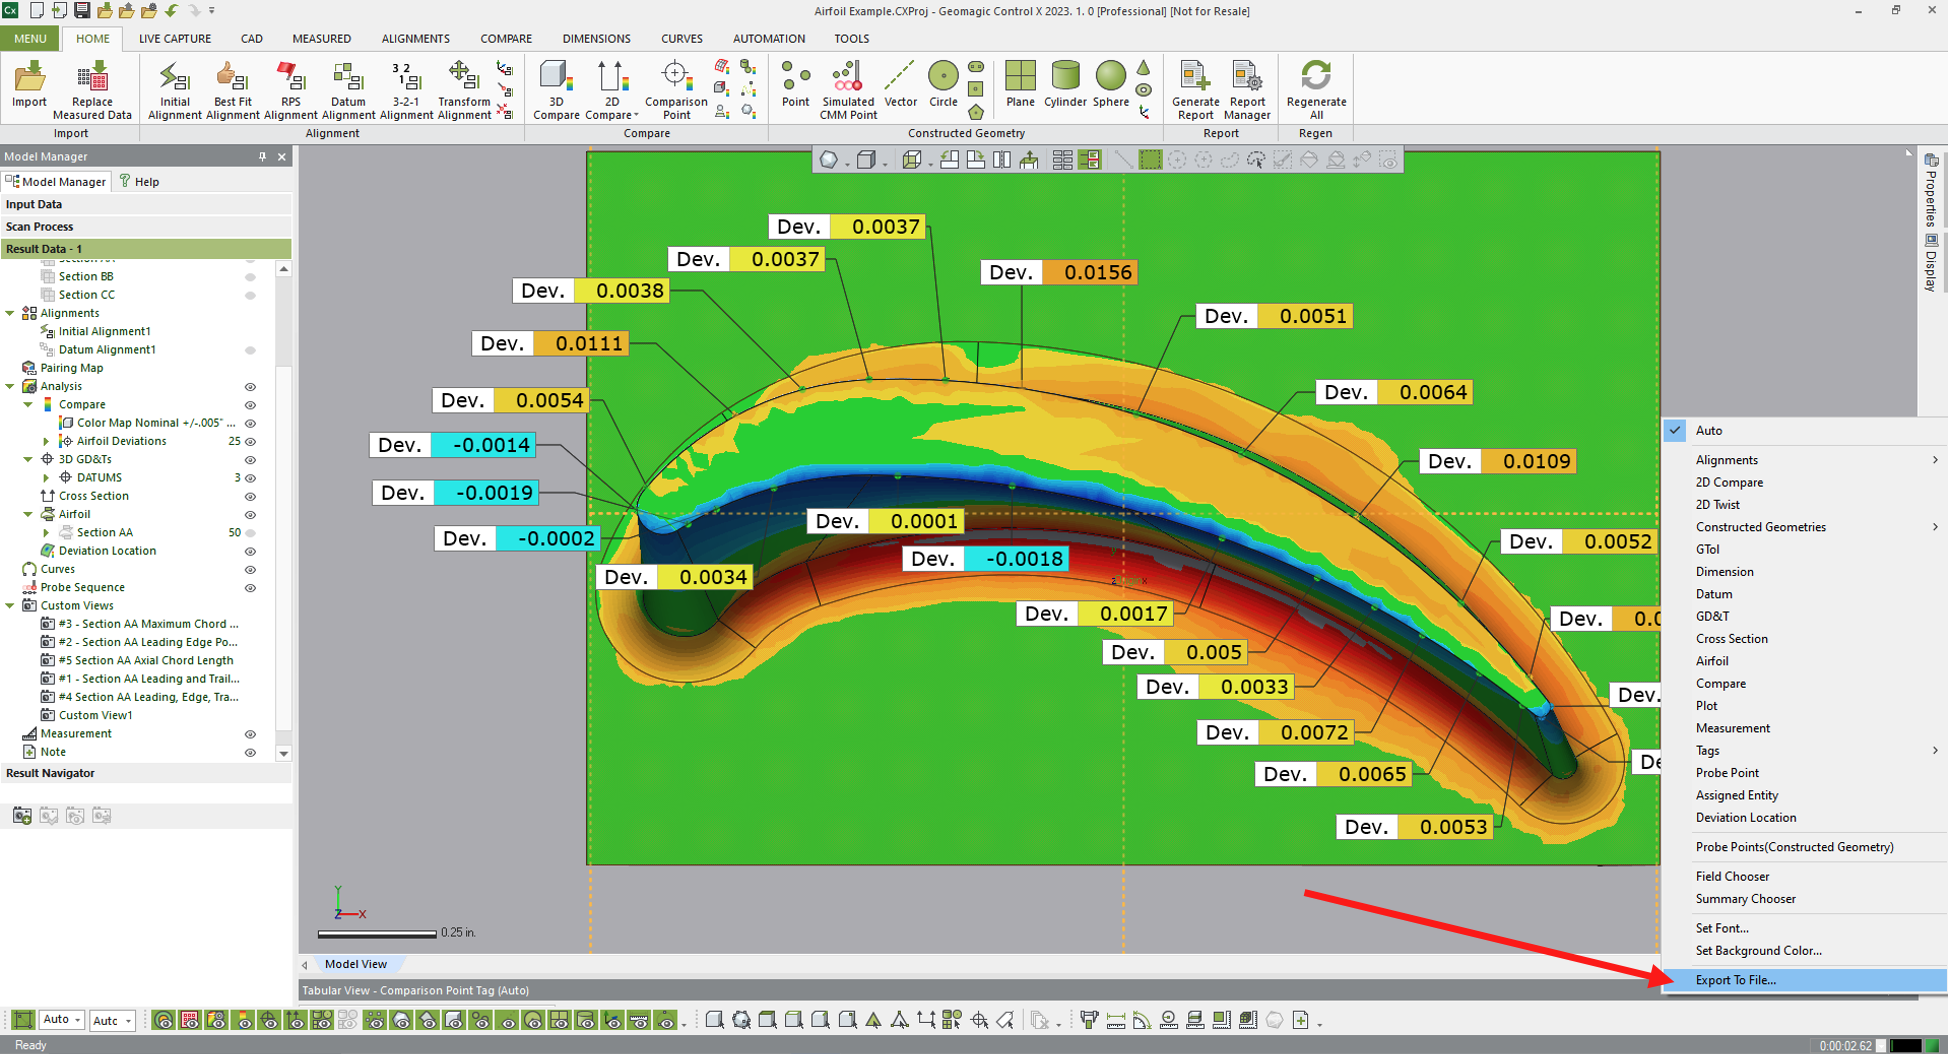
We can then select the tool to export the data to a text or CSV file.
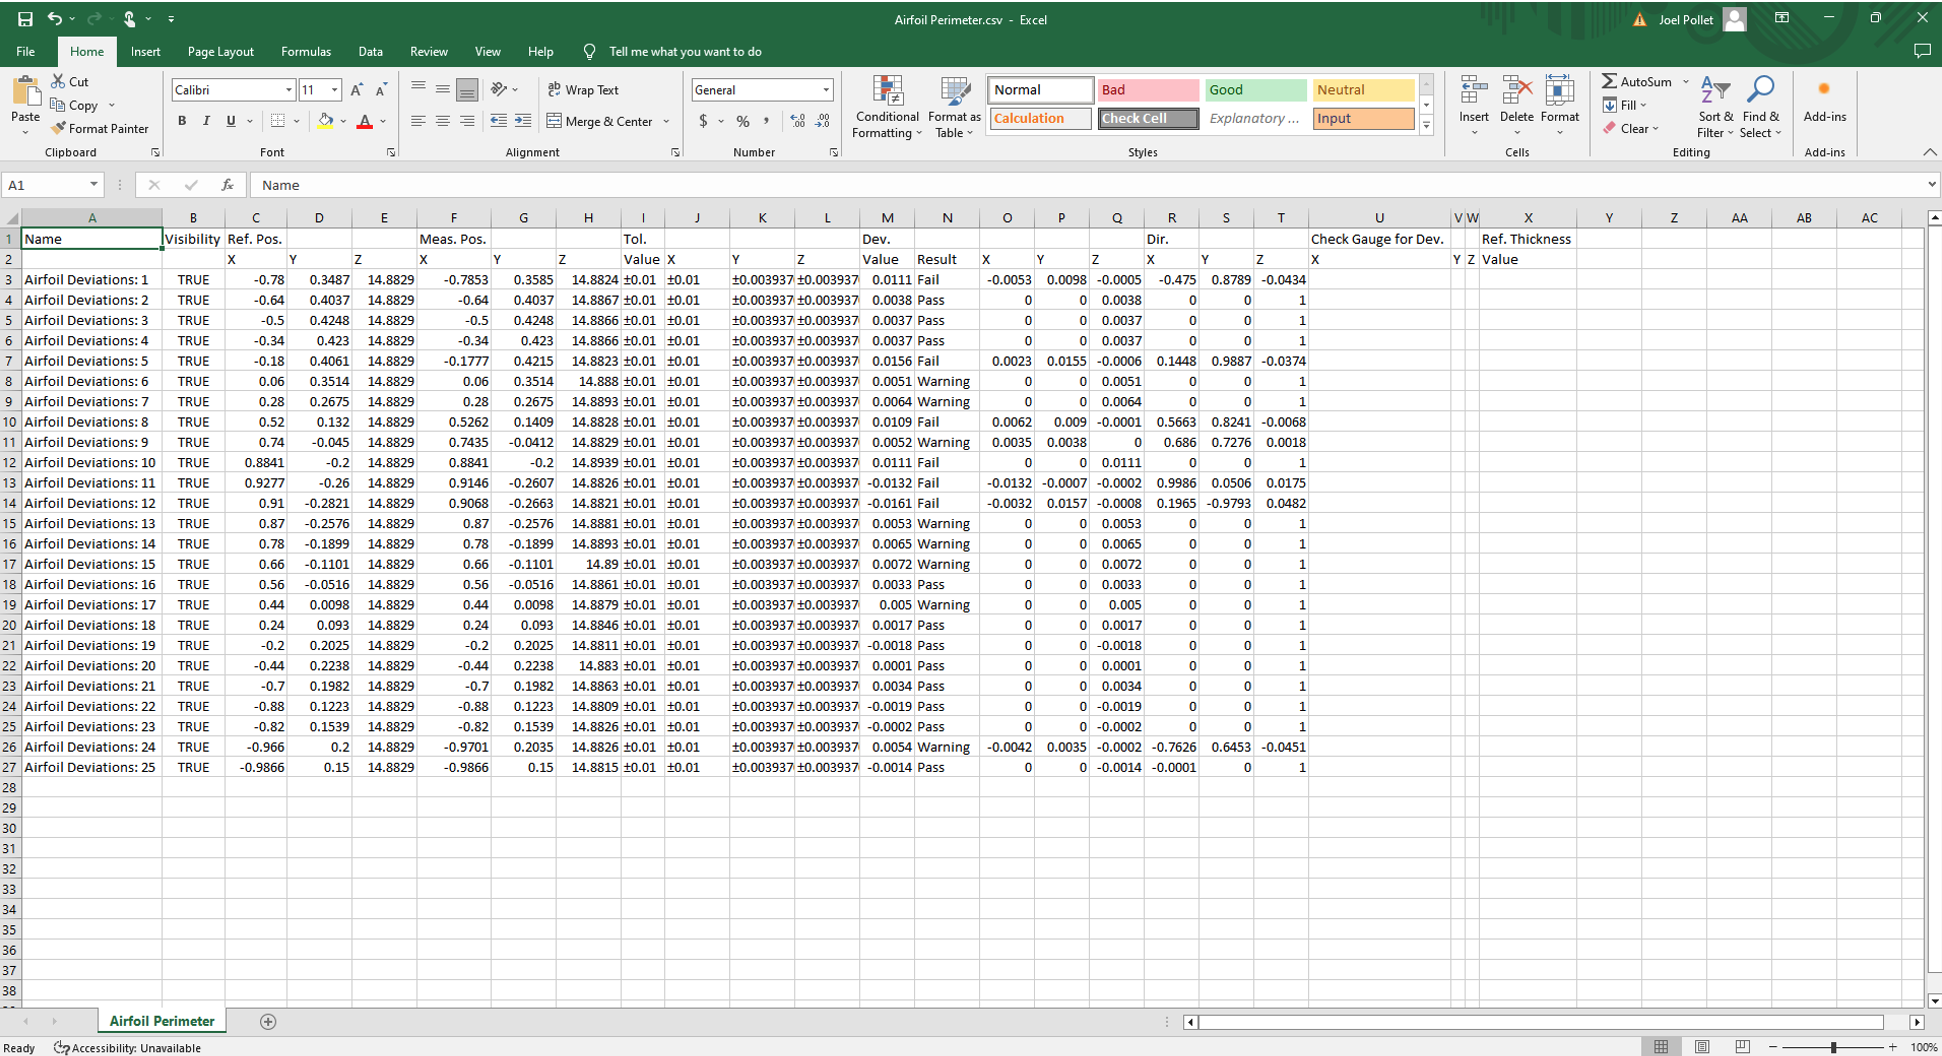
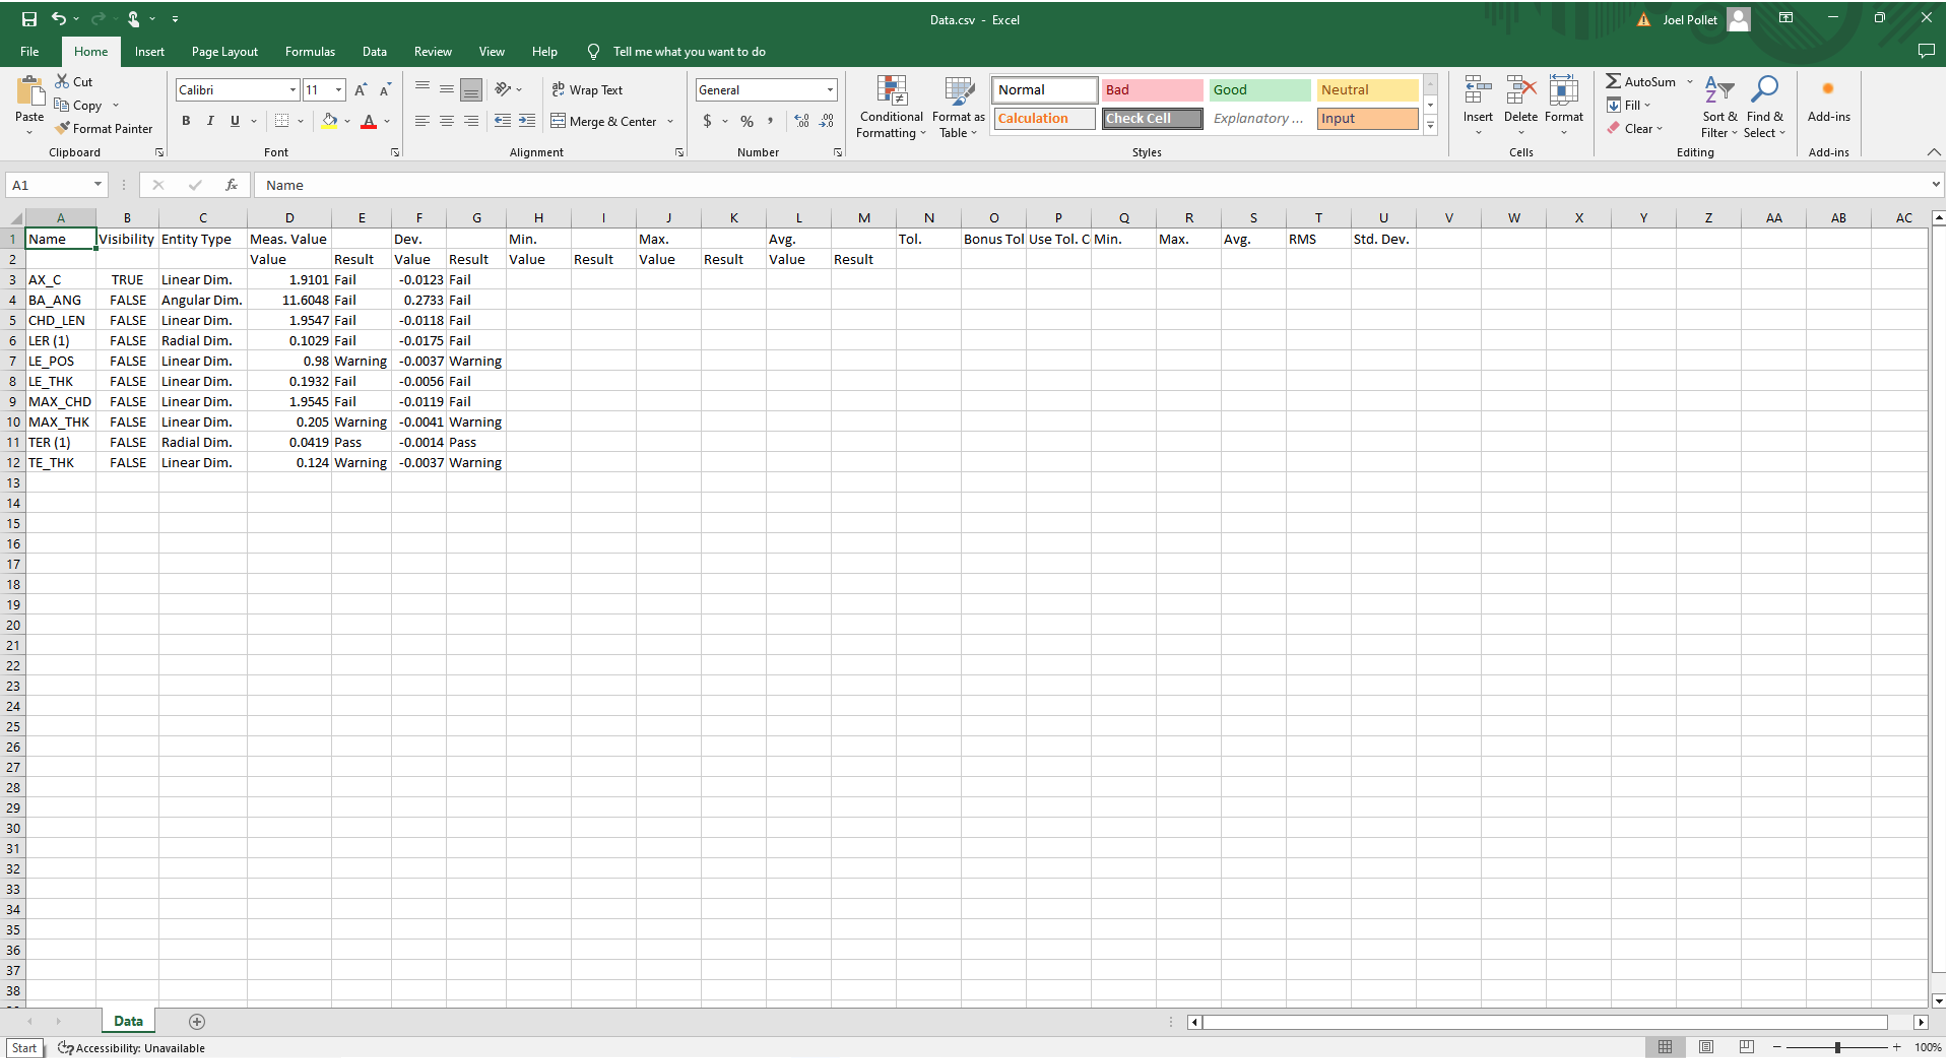
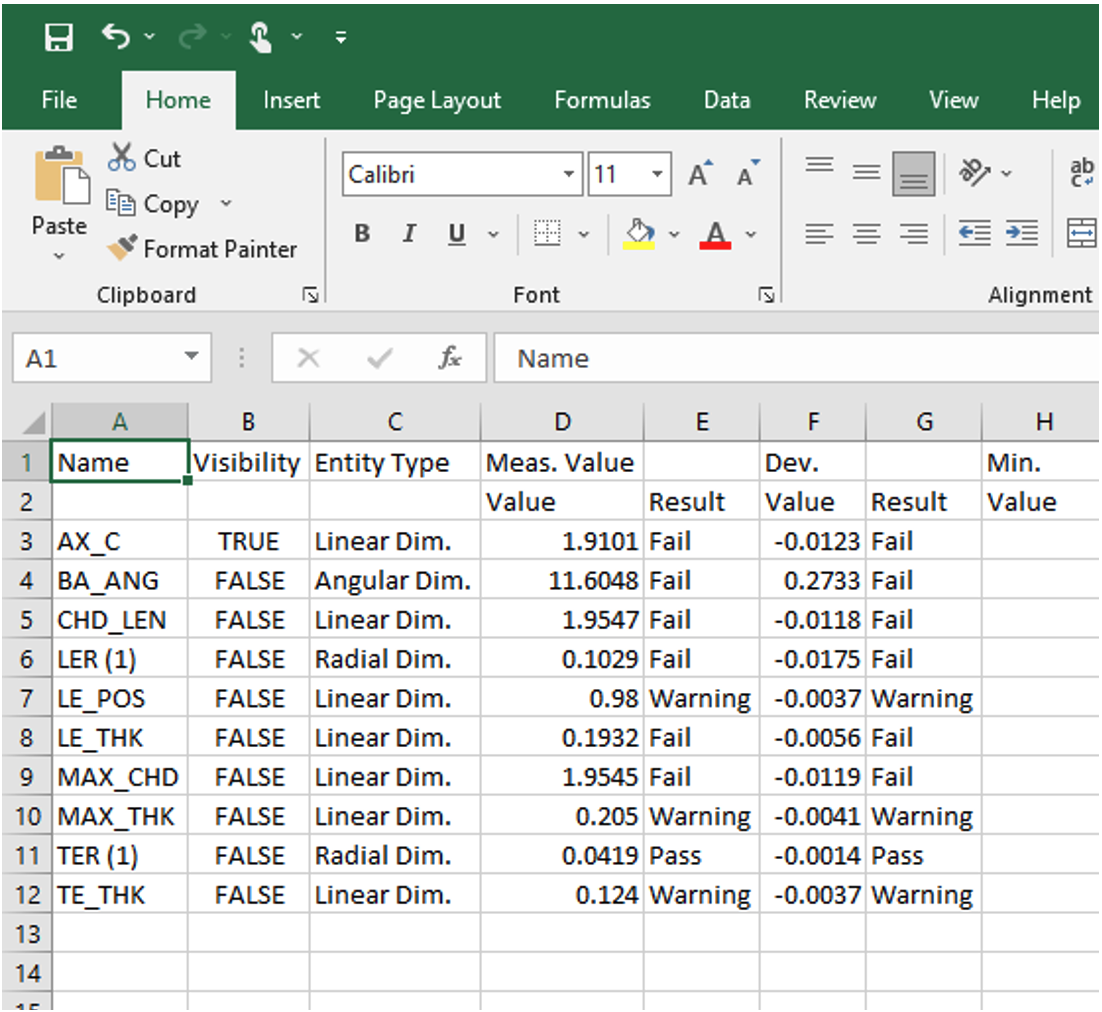
Control X will generate a datasheet with all the information required regarding each randomly selected point with regards to both the selected point on the airfoil surface, as well as the deviation of the airfoil scan from that point.
- Ref Pos values are the randomly selected points, directly on the nominal CAD model.
- Meas Pos is the same point, projected using a normal vector from the Ref Pos.
- Dev Value is the length of that deviation vector showing the actual deviation distance.
Now let’s look at the custom analysis capabilities of the Airfoil analysis tool and export specific data relative to the airfoil’s key dimensional characteristics.
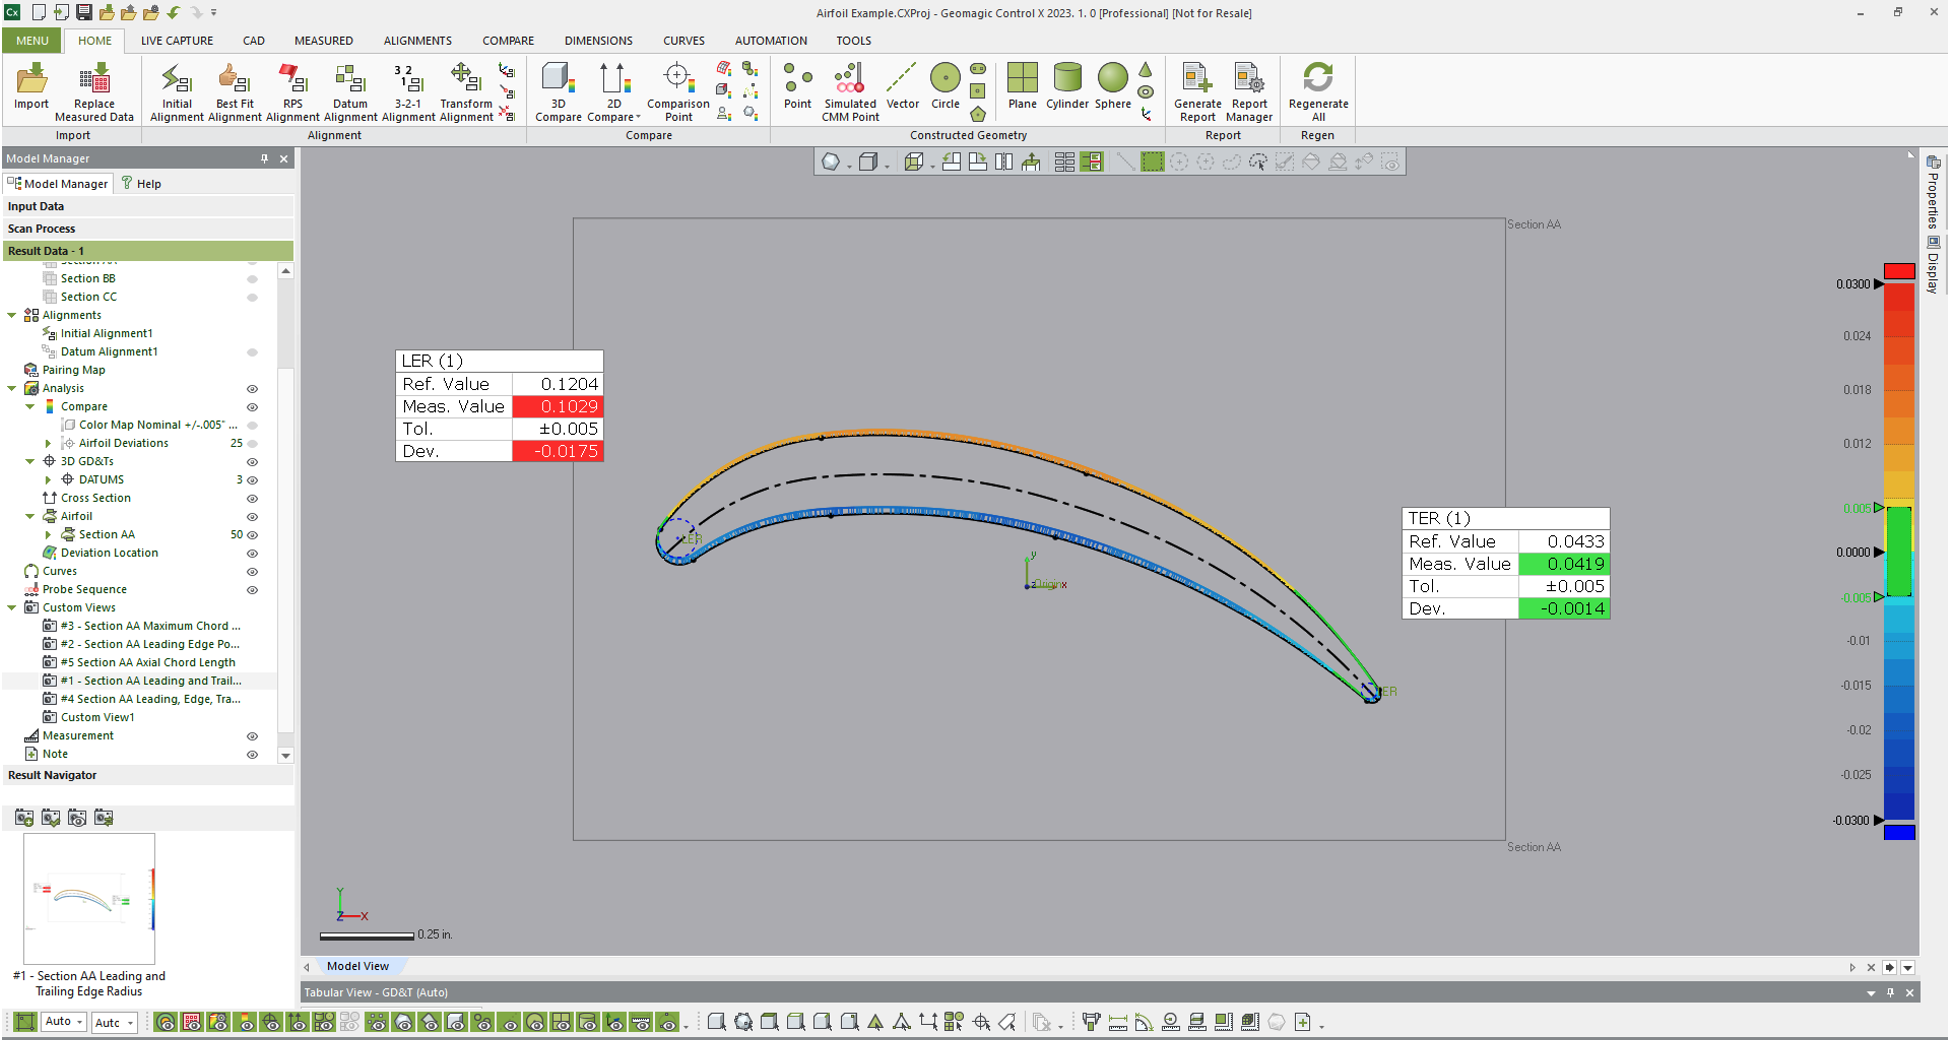
Leading and Trailing Edge Radii at our chosen section.
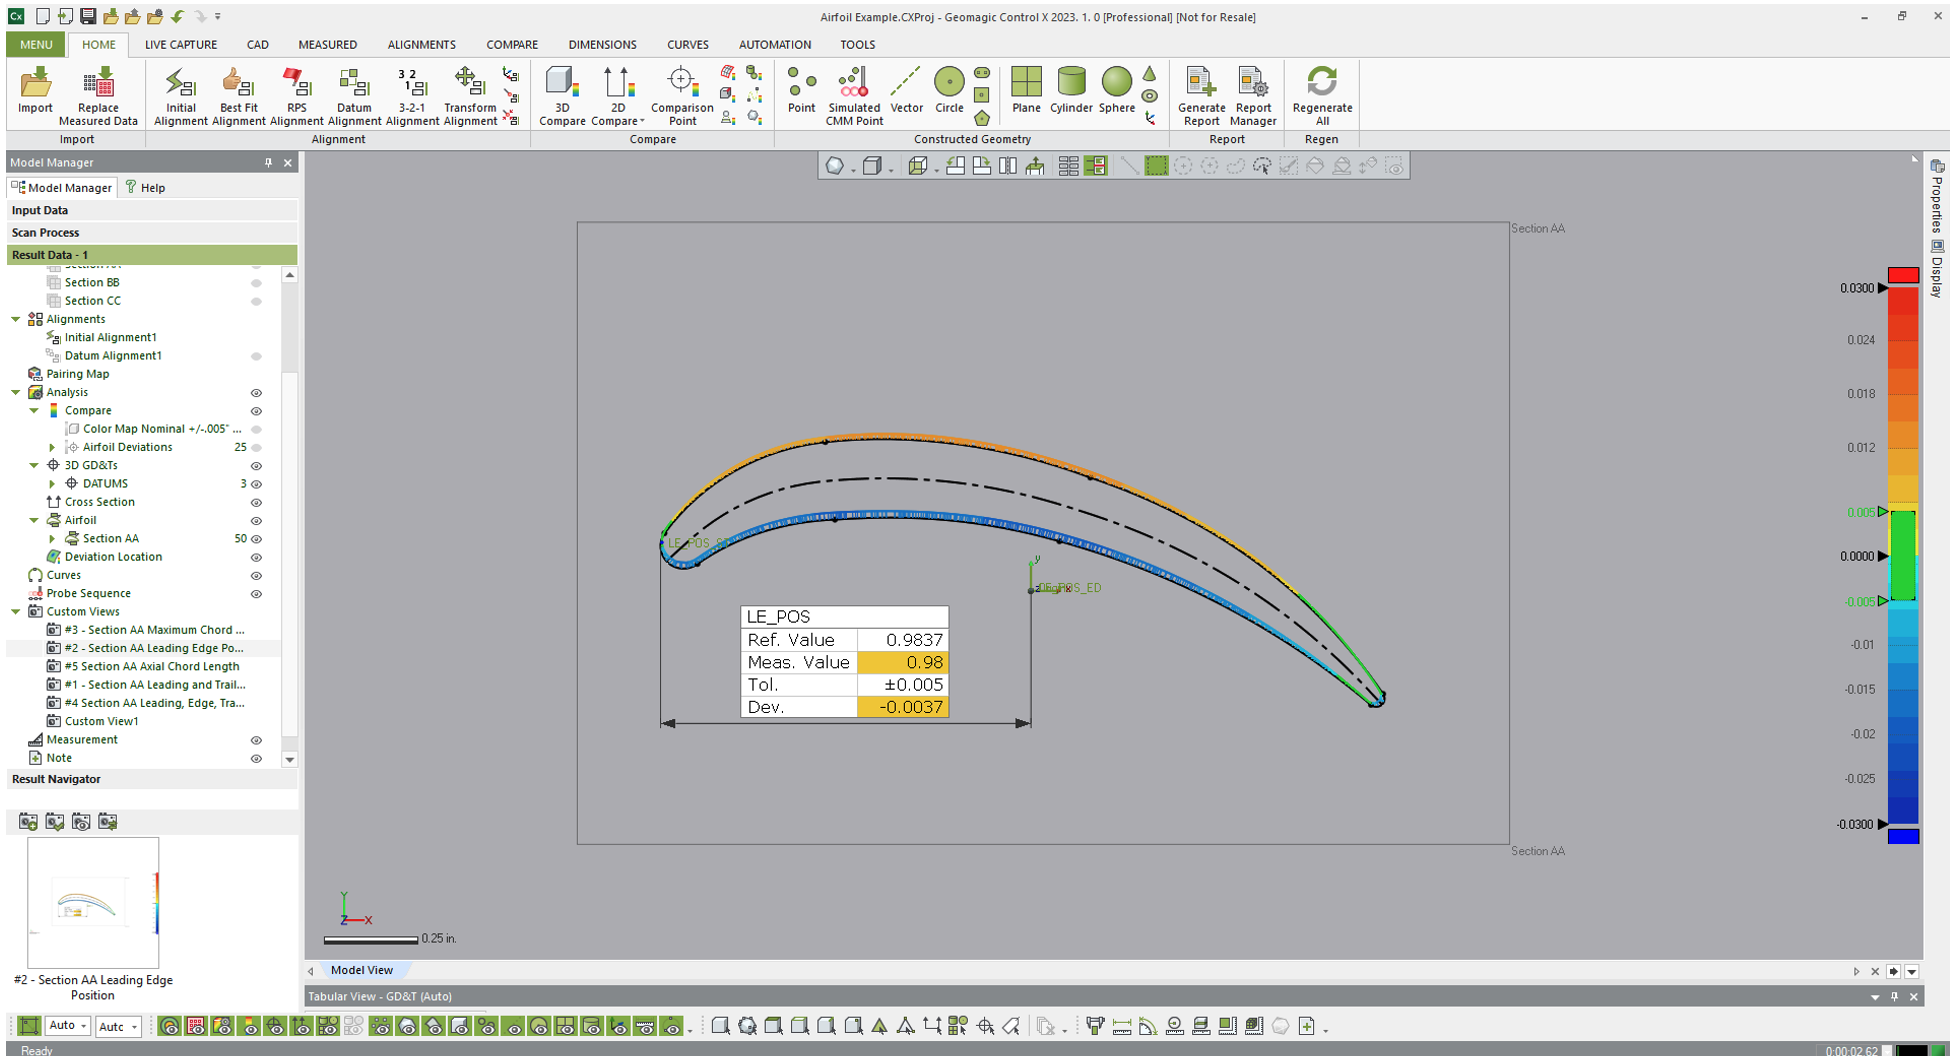
Leading Edge Position
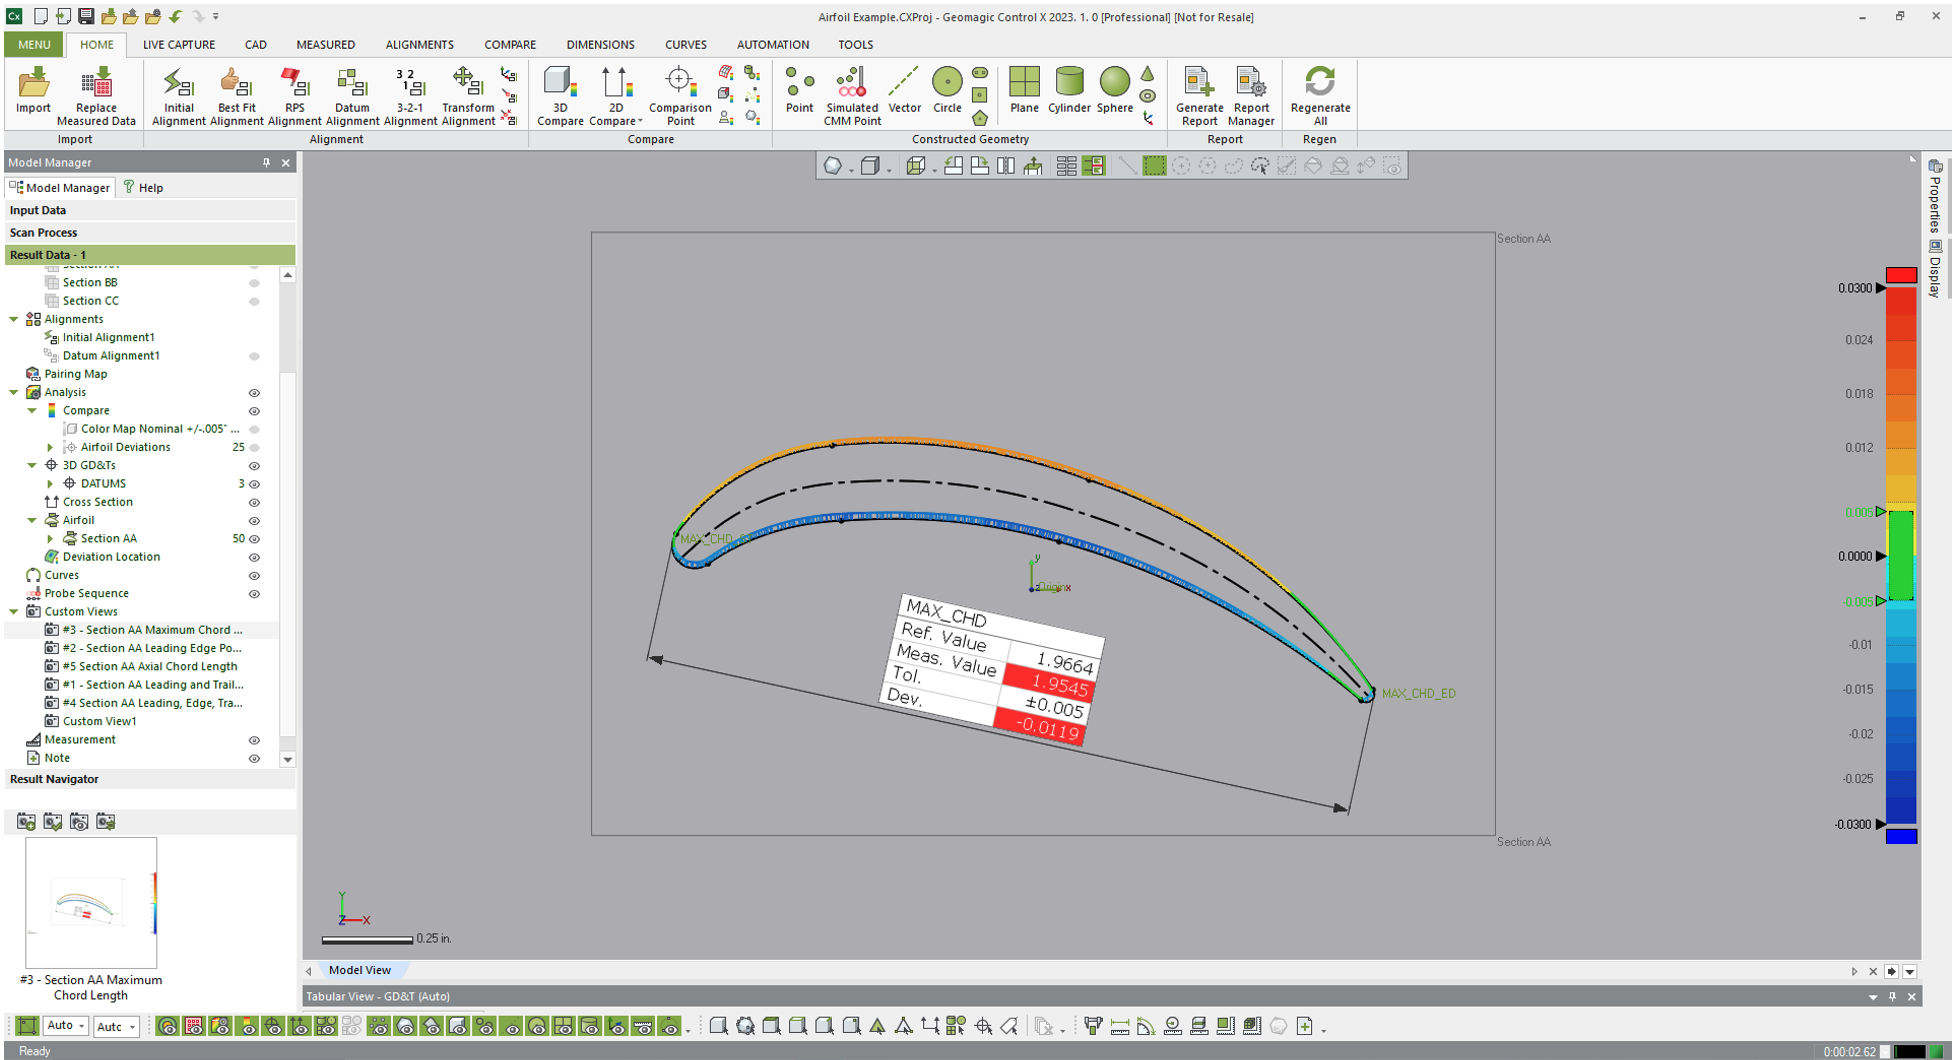
Maximum Chord Height
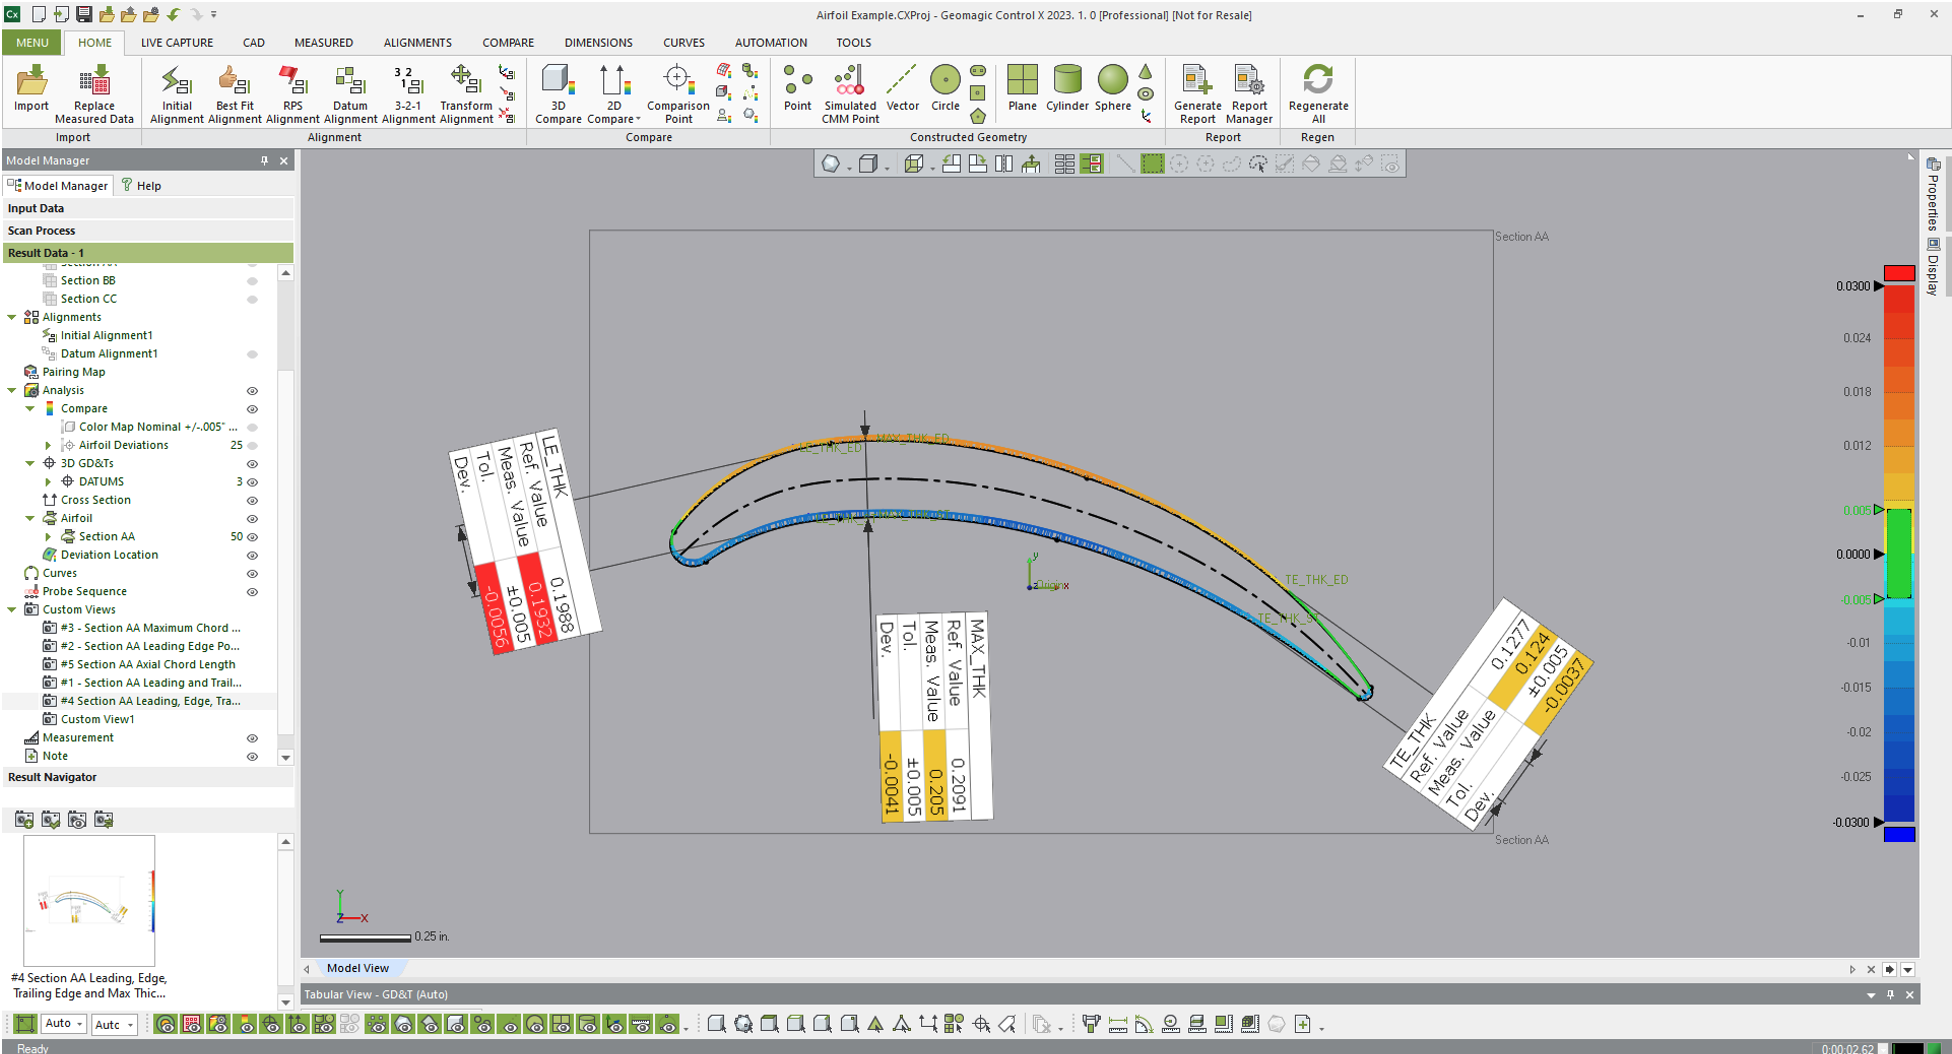
Leading and Trailing Edge Maximum Thickness
Axial Chord Length
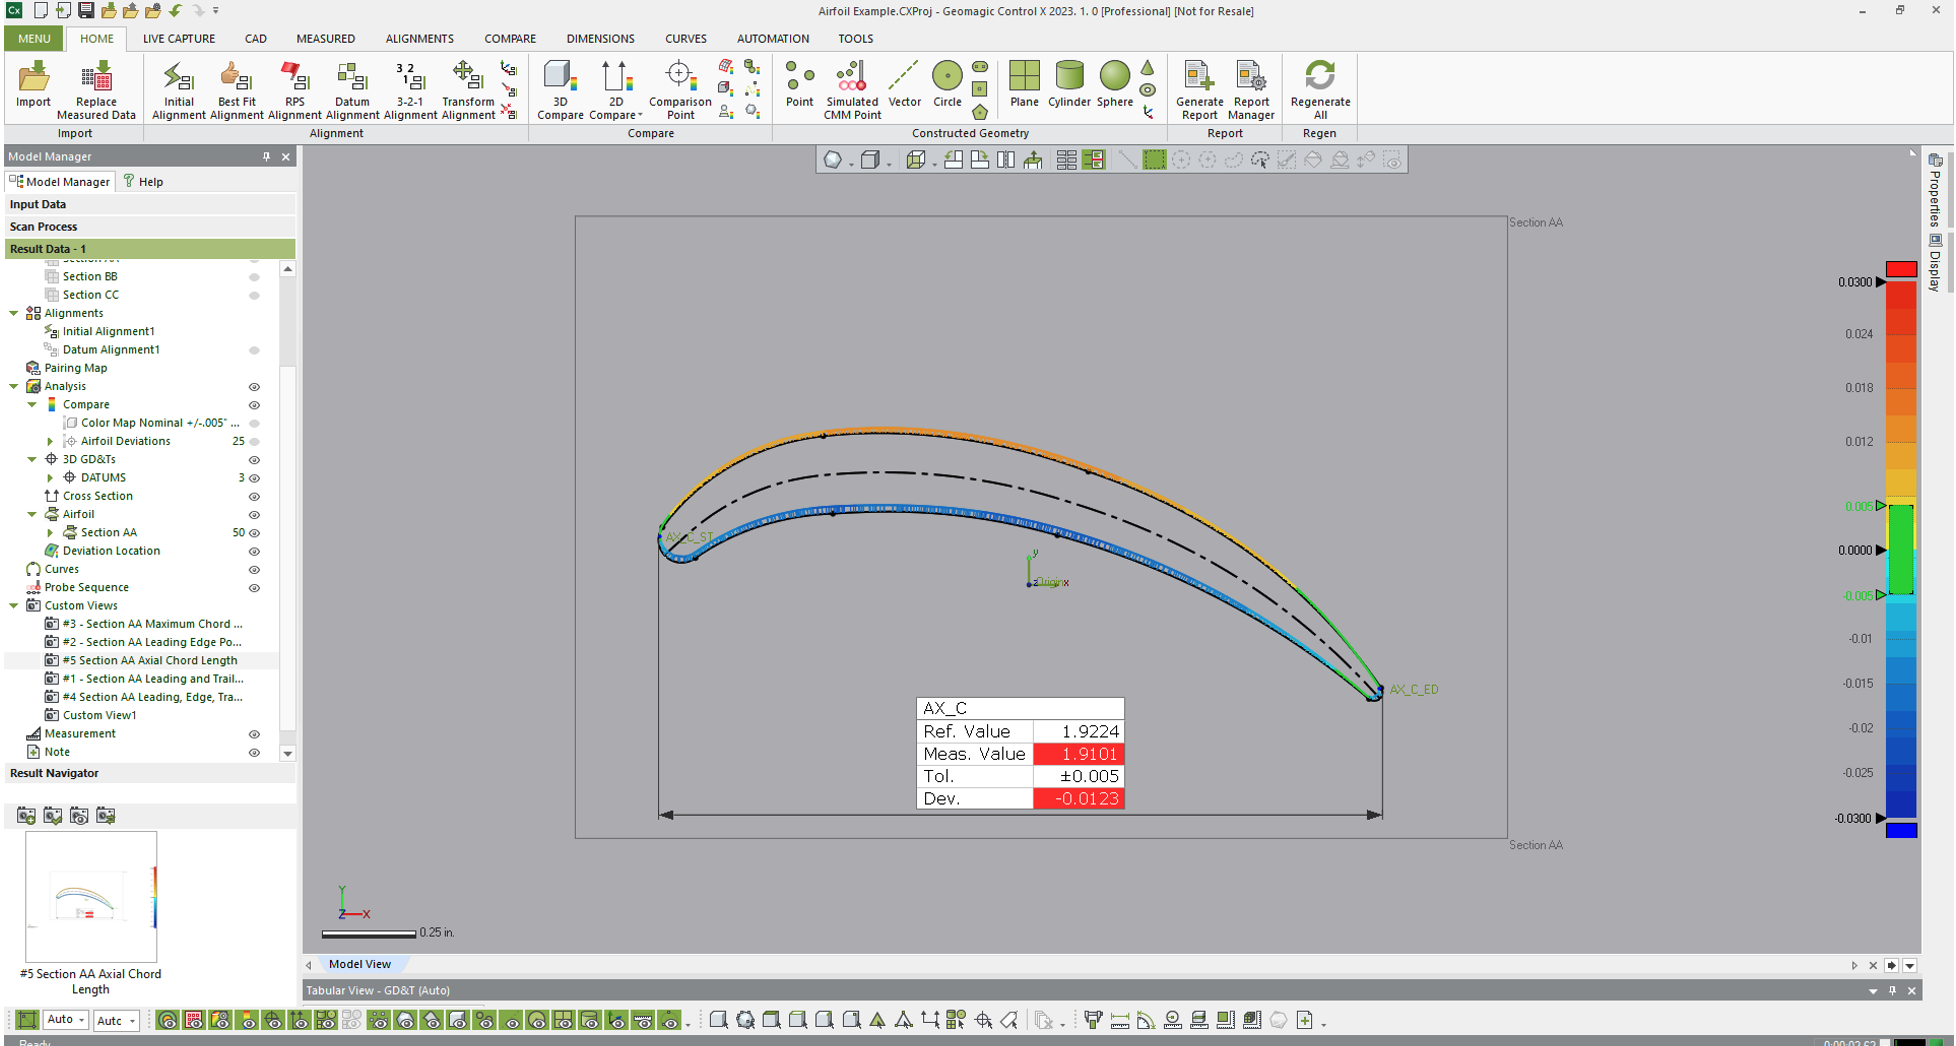
In our Control X Model, we represent each of these as a Custom Section.
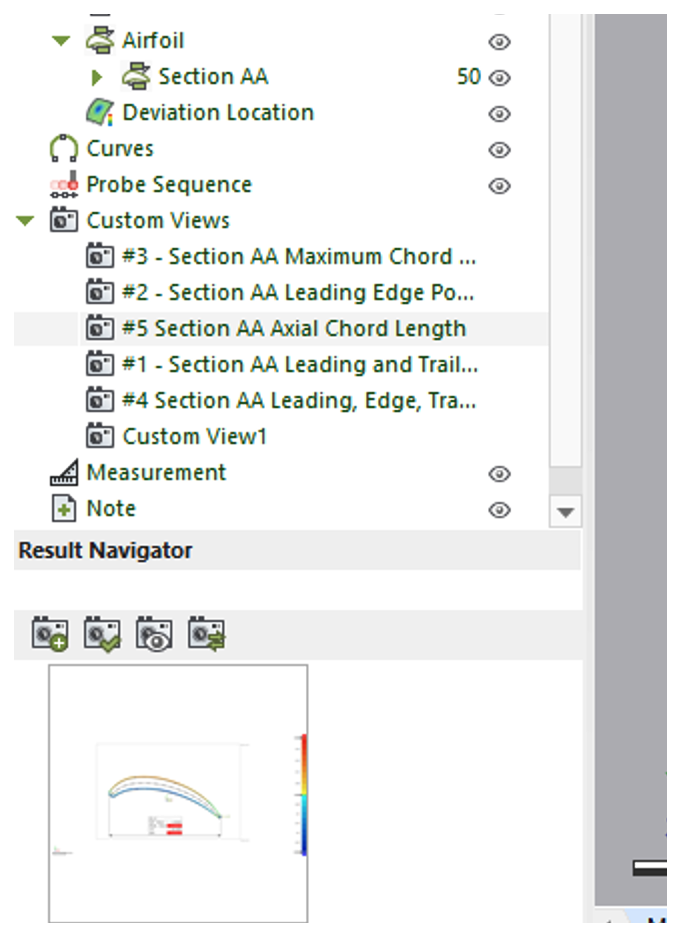
We can now highlight each of those sections and export their data to a CSV file as well.
Please contact Joel Pollet for additional information.

Leave A Comment